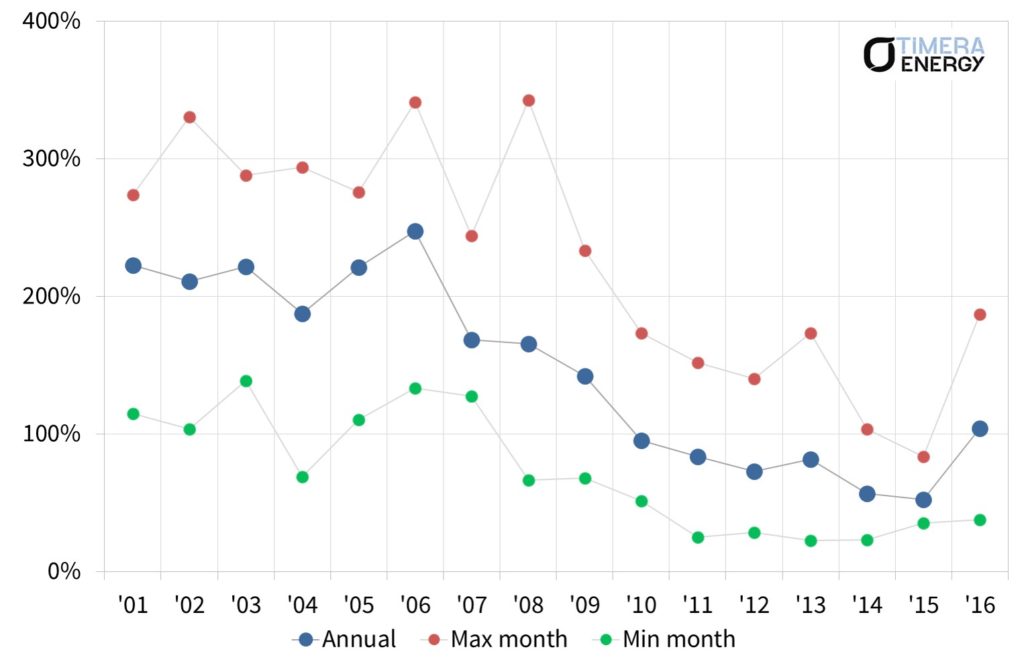
European spot gas price volatility has been in structural decline since the middle of last decade. Volatility levels above 200% in the UK gas market were common across the first half of the 2000s. But by 2014 volatility levels had sunk to under 50%. Only in 2016 have the first signs of a more sustained recovery in volatility started to emerge.
Chart 1 shows the evolution of historical UK spot gas price volatility since 2000. Falling gas price volatility has been caused by the commissioning of new flexible infrastructure, improved interconnection and declining European gas demand, particularly swing demand from the power sector.
Note: Spot volatility calculation is based on System Average Price (SAP) and excludes extreme price jumps (>3 standard deviations)
But is a 200% volatility level at a 15 p/th NBP price in 2000 directly comparable to 50% volatility at a 60 p/th price in 2014? The answer is not really. The absolute level of gas prices matters as well as the percentage level of volatility.
In today’s article we explore this rather under-appreciated phenomenon. We do this using an NBP case study because it provides the longest historical dataset (back to 2000).
Price times volatility
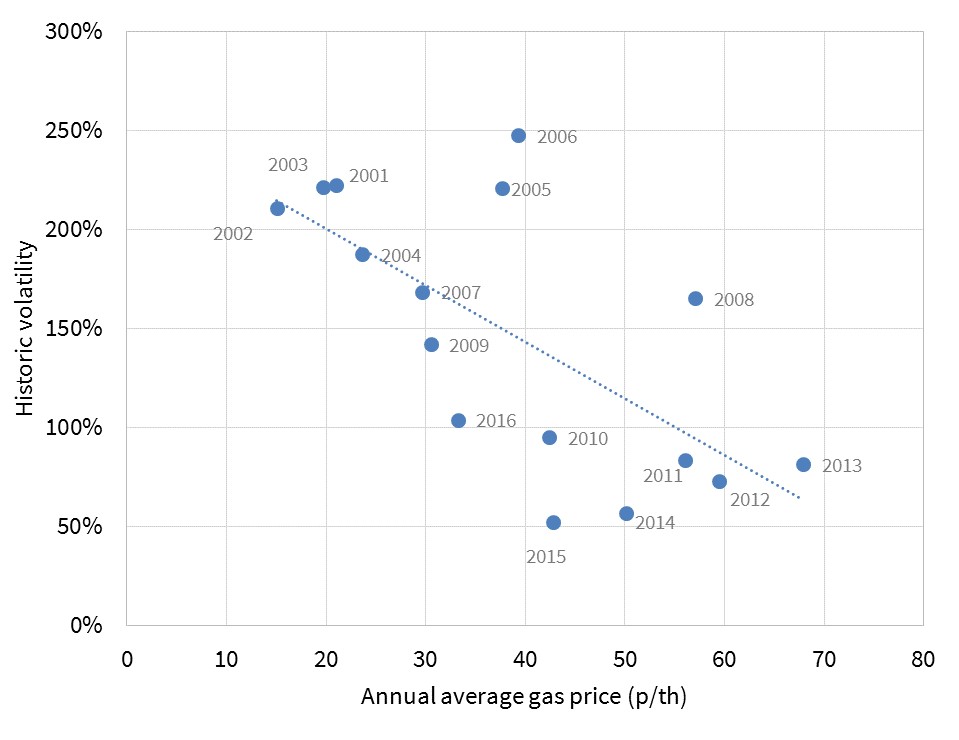
Volatility is a measure of relative price movements. But it is absolute price movements that actually drive asset returns. For example with a storage asset it is the absolute difference between injection and withdrawal price that drive cycling margins. Chart 2 shows different combinations of annual average NBP prices and historical volatility levels. The chart illustrates how periods of higher NBP volatility have historically been associated with periods of lower gas prices.
NBP gas prices were relatively low from 2000-05, with relatively high levels of spot volatility. Conversely, NBP prices have been relatively high across the 2010-15 period, coinciding with lower volatility levels. This is logical given an absolute move in price represents a larger percentage change of a lower gas price than of a higher price. This means that focusing on a decline in percentage volatility alone, tends to overstate the impact on decline in the value of assets such as gas storage.
Normalising for price
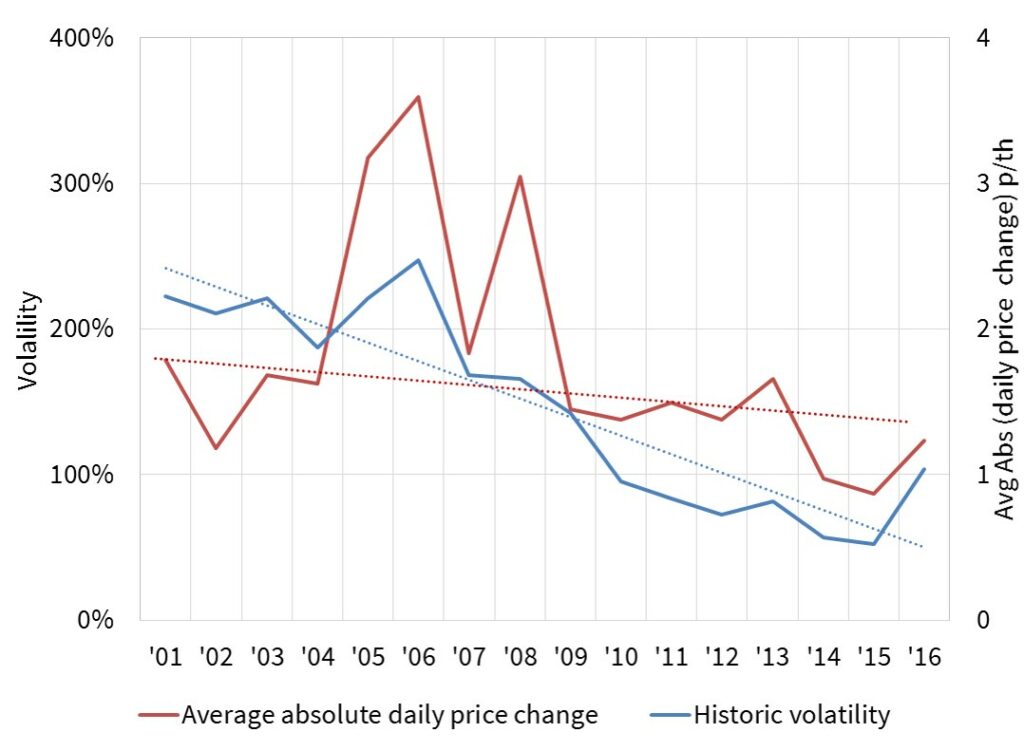
‘Average absolute daily gas price change’, a mouthful of a name, is a metric that can be used to normalise the impact of absolute gas prices. This is useful because it is reflects the movements in price that actually drive flexible asset value. Chart 3 shows the relationship between 1. the absolute daily price change metric and 2. the more commonly used percentage volatility metric. The chart shows that while 1. has declined steadily between 2005-15, the reduction has been less extreme than 2.
So whilst the margins accruing to flexible asset owners has been in decline over the last 12 months. Looking at it through a pure volatility lens somewhat overstates the decline.
2016 volatility recovery
Both measures of volatility show a clear recovery in 2016. There is still room for a further rise if December proves to be a cold month. However the December risks have fallen somewhat this week with Centrica Storage announcing that the UK’s large Rough storage facility would be back on line for withdrawals of existing inventory by Dec 9th at the latest.
As we move into 2017, several key issues remain looming over the North-West European market for gas supply flexibility:
- What happens to Rough after it limps through the current winter?
- To what extent will the CCGT load factor recovery remain/continue (supporting gas swing demand)?
- How will loss of Groningen supply flexibility impact hub prices?
- How many more existing storage facilities may be mothballed or closed given an inability to cover fixed costs?
These issues are set to play a big role in determining whether the 2016 recovery in volatility is temporary or structural.
Article written by Olly Spinks and David Stokes