“Everything comes back to gas prices”.
It is not only direct participants in the European gas market that are concerned about the path of hub prices. The direction of TTF and its satellite hubs has a much broader impact across energy markets. For example:
- Thermal power: Power assets exposed to wholesale power prices have a strong indirect exposure to gas prices. This is the result of the important influence of hub prices in setting power prices across Europe (which is increasing as coal & nuclear plants close).
- Renewables: Gas price influence on wholesale power prices also drives the relative competitiveness of renewables versus alternative capacity types (particularly important for the transition to standalone renewable investment).
- LNG market: Europe’s role as swing provider to the LNG market means that European hubs underpin global LNG spot prices, with regional markets pricing off a basis to TTF.
In an article two weeks ago we set out the current state of supply and demand balance in the European gas market. Today we analyse in more detail the drivers of hub price evolution over the next few years with a particular focus on the importance of gas vs coal switching in the power sector.
Unusual uncertainty over next 3 years
The growing importance of gas prices for asset value sits against a backdrop of rising uncertainty as to hub price levels.
In our view, the distribution of potential hub price evolution across the next 3 years is an unusual shape. Rather than a classic ‘bell curve’ normal distribution, there appears to be an unusually broad and flat distribution of potential outcomes.
We also believe this distribution is asymmetrically skewed to the downside as the result of an oversupply of LNG over the next 3 years. In other words, the risk of lower prices is greater than that of higher prices.
Current TTF forward gas price levels are around the 6.5-7.5 $/mmbtu range across 2019-21 (18.8-21.7 €/MWh). To illustrate gas price uncertainty, it is relatively easy to define credible scenarios that deviate significantly from these price levels, e.g.
- Price slump: where hub prices fall 40% by 2020-21 to around 4.0 $/mmbtu (11.6 €/MWh) e.g. if European LNG imports rise sharply and coal prices decline.
- Price rise: where hub prices rise by 20%+ into the early 2020s e.g. if coal prices rise strongly and Asia comfortably absorbs new LNG supply coming to market.
Switching of gas for coal plants in the power sector is a key mechanism driving marginal hub price levels within this distribution.
Switching as a driver of gas prices
Switching is a relatively simple concept. As gas hub prices fall, gas-fired power plants become more competitive relative to coal plants, with load factors and gas burn increasing accordingly.
This creates additional gas demand and supports hub prices. The process works in reverse as hub prices rise.
This switching mechanism happens in real time based on spot gas, coal and carbon prices. It also influences relative movements in forward gas prices (based on future switching impact).
In order to analyse the role of switching in driving European hub price levels, it is useful to apply a three step framework:
- LNG surplus: determine what volume of surplus LNG may flow into European hubs over the next 3 years
- Switching: define how volumes of surplus LNG can be absorbed by power sector switching and at what combination of gas, coal (& carbon) prices
- Gas price impact: determine the hub price levels required to balance the European gas market (& therefore the global LNG market given Europe’s role as swing provider)
We looked at the volume range of potential LNG surplus (1.) in last week’s article. In today’s article we put some numbers around 2. and 3. (switching potential & hub price impact).
Defining the switching range
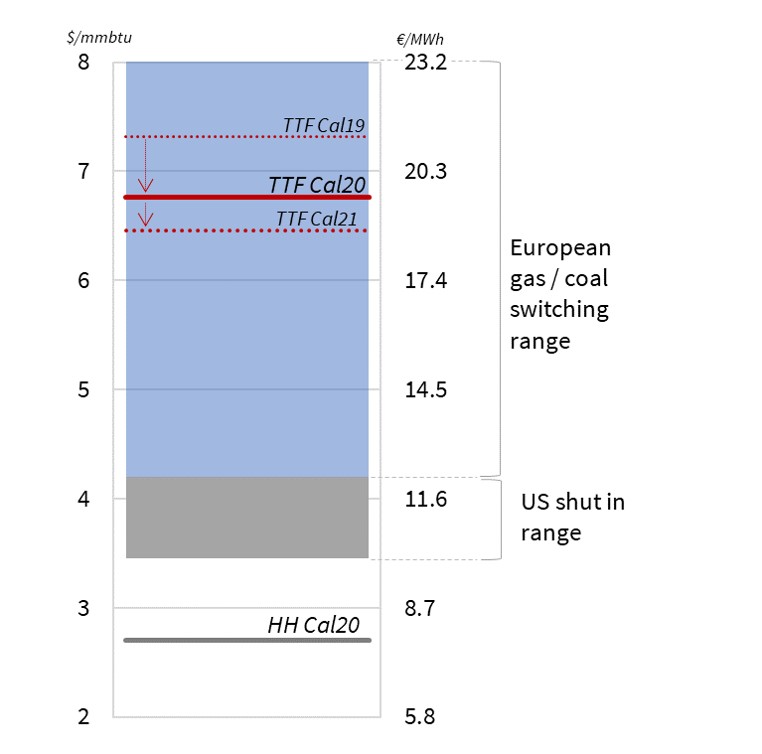
Chart 1 illustrates the hub price range over which switching is important (shaded in blue). It shows this in the context of the current differential between TTF forward prices and US Henry Hub. Backwardation in the current forward curve can be seen in the relative price decline from 2019 to 2021.
The top end of the switching range is defined by the point at which the UK power sector (with its carbon price floor) switches all its coal capacity back into merit (significantly above 8.0 $/mmbtu).
The lower end of the switching range is defined by the point at which US LNG export ‘shut ins’ transition to be the primary mechanism for absorbing surplus gas. Shut ins occur if the variable costs of exporting US LNG falls below netback spot prices. This is likely to happen if European hub prices fall below a 0.7-1.5 $/mmbtu variable LNG transport cost differential to Henry Hub (marked as the grey shaded area).
Switching continues in the grey ‘shut in’ range. It is just that shut ins are a much more dominant volume driver once gas prices fall to this level, given the ability for relatively large volumes of US export supply (80+ bcma) to be shut in over a relatively narrow price range.
Switching demand curves
It is one thing to understand the range over which switching is a dominant driver. It is another to define switching price & volume levels and their impact on hub prices.
In order to perform a robust analysis of aggregate gas vs coal switching potential in Europe, it is important to model the underlying dynamics of the individual power markets which drive switching. To enable this, we have set up a scenario in our pan-European power market model that reflects current forward market pricing for fuels. This provides a benchmark for aggregate power sector gas demand given current gas and coal market prices.
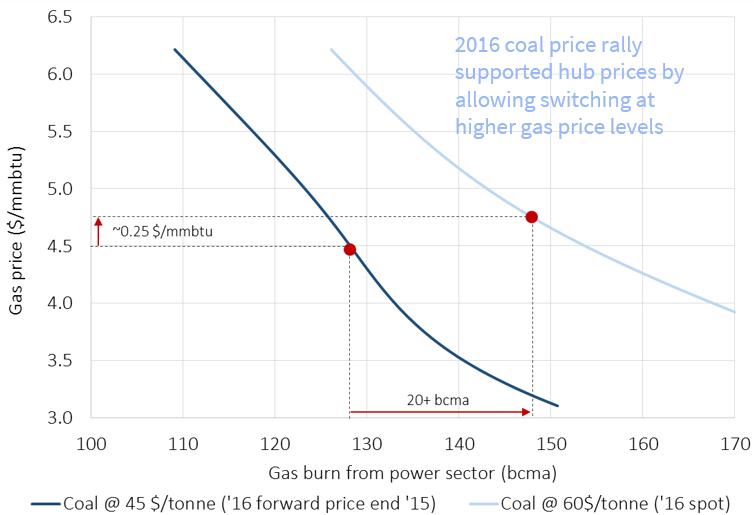
We then run multiple combinations of gas and coal prices through the power market model, in order to analyse aggregate pan-European gas vs coal switching potential. This allows us to produce gas switching demand curves for the different combinations of gas & coal prices shown in Chart 2.
Each line in the chart can be thought of as an aggregate gas demand curve for the European power sector. In other words, the lines show aggregate gas burn (bcma) as a function of gas price. Three different demand curves are shown for different coal prices.
The central line shows switching dynamics at current forward coal prices for European delivery (approximately 90 $/t). As you move from left to right down this line, gas switching volume increases as gas prices fall.
For example, a fall in gas prices from the 2019 forward price level (7.3 $/mmbtu, 21.2 €/MWh) to the ‘shut in’ range (4.2 $/mmbtu, 12.2 €/MWh) yields about 30 bcma of incremental switching demand, assuming coal (& carbon) prices are constant.
Coal prices typically move with gas prices (although not always in a correlated way). In order to understand the impact of changes in coal prices, we have also produced switching demand curves for coal prices 30 $/t above and below the 90 $/t central case (at 60 and 120 $/t).
As an example, if coal prices were to rise to 120 $/t, European hubs could support similar levels of power sector gas burn at prices around 1.7 $/mmbtu (4.9 €/MWh ) above current levels. This example illustrates why hub prices are currently rising with coal prices as switching levels increase accordingly.
Conclusions on gas price levels
In last week’s article we set out the potential volume range of LNG that may be surplus to ‘business as usual’ requirements in Asia & Latin America (15-70 bcma in 2020). Not all of that surplus LNG will flow to Europe.
There is likely to be some incremental demand response in Asian markets at lower spot prices (e.g. 10-20 bcma of additional demand if prices fall below 5.0 $/mmbtu). But there is certainly a credible risk in our view that 40+ bcma of surplus LNG could flow to Europe by 2020-21 in a scenario of weaker Asian demand growth.
Our switching analysis shows 20-30 bcma of accessible incremental switching potential in Europe, before hub prices fall to US shut in levels. This switching volume would rise if coal and/or carbon prices continue to increase.
If surplus LNG flows to Europe remain below this 20-30 bcma level, then switching should allow hubs to absorb extra cargoes (e.g. in a 5-7 $/mmbtu price range based on current coal/carbon prices).
But if surplus LNG imports into Europe rise above 40 bcma, it is hard to construct a scenario where US shut ins are not required. That would likely mean European hub prices at levels below 4.5 $/mmbtu (13.0 €/MWh), maybe as low as 3.5 $/mmbtu (10.1 €/MWh).
We are not predicting this low price scenario, but it is a credible downside risk flashing on the radar screen. And it represents a substantial deviation from current forward price levels.