Commodity price forecasts are widely used across energy markets. Forecasts are used as an input for a range of commercial activities including business plans, budgets and investment cases. In fact some view of the future evolution of commodity prices is a pre-requisite for many of these activities. But the principle danger associated with price forecasts is not recognising their limitations.
For want of a better source of information, price forecasts are often based on current forward market price information. This may be associated with the common misconception that forward curves represent a market consensus forecast of future spot prices. In today’s article we use a practical case study based on Brent crude oil price forecasting to illustrate the dangers of relying on price forecasts.
We published an article on Mar 30th setting out the importance of distinguishing between forward curves and forecasts of future spot prices. In this first article in a series on ‘forecasts vs. forward curves’, we described the superficial visual similarity between graphs of both, and the common but erroneous belief that the forward curve is somehow a ‘market consensus spot-price forecast’.
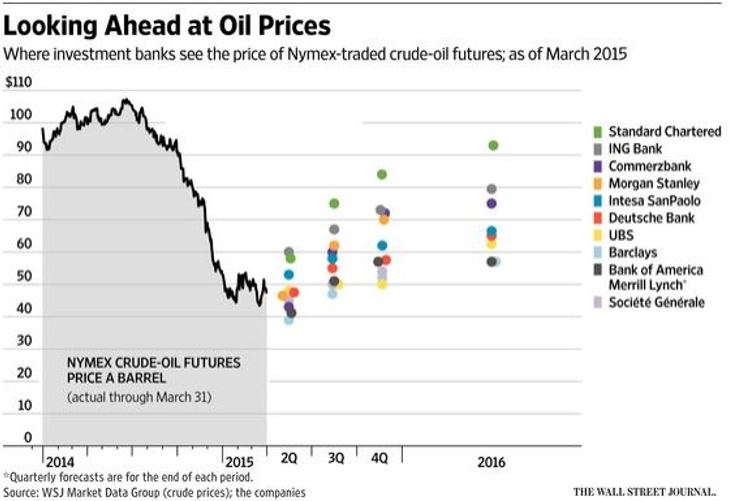
Spring 2015 marks a phase in the evolution of Brent prices, both spot and forward, when professional price forecasters have diverged dramatically in their views of what will happen over the next two years. Chart 1 shows the Mar 2015 spot-price predictions of ten leading oil market analysts for the remainder of 2015 and 2016.
Chart 1: Brent price history and forecast range

Source: Wall Street Journal
The remarkable spread in forecaster views is immediately obvious. Even for the current quarter of this year (Q2), the highest pick is 54% greater than the lowest, a disparity rising to 68% for the fourth quarter. The scatter is almost uniform for the third quarter, and bunching only emerges at the end of the year when the group splits into a cluster of four higher-than-average tipsters and a second cluster of six who go lower-than-average in their outlooks. Only one consistent theme emerges across all: the price of oil is seen as rising steadily from the levels of second-quarter 2015. It is probably no coincidence that this reflects the current Brent curve contago.
Many oil producers may be disappointed, if not surprised, to see no-one forecasting above $100. Although it may be fairly observed that an average for 2016 of $93 (the highest prediction) would suggest that the Brent price is seen going back into 3 figures for at least some of that year by that forecaster, if by no-one else amongst the ten.
A consensus view?
Chart 1 is hardly a picture of consensus. To the contrary, it is difficult to recall a time of more divergent views since the post financial crisis market turmoil of 2008-09. However, it should immediately be registered that throughout the oil market price turmoil of those years, and of 2014-2015, the Brent market has remained very liquid along the forward curve. In other words, the forward curve is entirely meaningful on its own terms. That is it represents an array of prices at which actual forward business is being conducted in large volume today, irrespective of what anyone might think about where spot prices will be in the future.
So the failure of analysts to agree on the future does not in any way undermine the forward market’s willingness to make prices. This is yet another challenge to the perception that ‘forwards are forecasts’: for if the forward curve is to be seen as a market consensus how can it exist at all when, as at present, essentially there is none?
Putting Your Money Where Your Mouth Is
It is interesting to consider conceptually the uses to which price forecasts might be put. In principle, if a forecast carries any weight with the recipient – who may have paid good money for it – he or she should be willing to act as though future prices may reliably be expected to settle at approximately the levels projected. This may inform (for example) budget provisions, investment decisions or whether it is necessary to hedge a given exposure. If a company is long oil, and believes a forecast that predicts prices will rise, why would they hedge? The answer, amply illustrated over the years, is that whatever is ‘believed’ about the future, there can be surprises in store for anyone.
In circumstances such as now, when forecasters diverge so significantly in their views, few players with significant money at stake are likely to consider it safe to leave their exposed oil positions unhedged. The fact remains that at all times, even when there seems to be a consensus amongst professional pundits, if a position is technically open and the holder does not wish to carry the risk, then only a hedge will do. A chart with some numbers on it, whoever generated the numbers using whatever methodology and irrespective of their track record, can never substitute for a watertight forward hedge with a creditworthy counterpart.
What is ‘a good forecast’?
The writer is reminded of an incident of some twenty five years ago. Working for an oil company at the time, he was called in by his boss and told: “we need a good forecast” – a phrase often heard from many different people on many occasions since. But what could this possibly mean? Is a “good forecast” the one that costs the most? The one that makes our projects look most attractive? How could we tell in advance which one is going to be the most accurate? At best, it might translate as: we need a forecast from a source or methodology which has a consistently good track-record over a long period of time.
Sadly, there is no such source or methodology. There is, however, a range of academic theories on the dynamics of forward prices, which we will consider in the next piece in this series.
This article was written by Nick Perry.

