Crude oil has doubled in price since February. The rally in oil has coincided with a broader recovery in global commodity prices including coal. Higher commodity prices have also started to feed through into gas and power markets in Europe.
Power prices in Continental markets have risen strongly in Q2. German Calendar Year 2017 baseload prices have risen 25% since the start of March (from 21.50 to above 27.00 €/MWh last week). Higher coal prices are the primary driver, given coal fired power plants currently dominate marginal price setting in Continental Europe.
European gas hub prices have been more subdued in 2016, weighed down by high storage inventories, robust domestic production and growing LNG import volumes. But the influence of higher oil prices has helped gas prices rise over the last month, with NBP rallying from below 4.00 $/mmbtu towards 4.70 $/mmbtu. This has in turn fed through into a similar rally in Asian spot LNG prices which are pricing off European hubs in an oversupplied global gas market.
In today’s article we take a step back and look at the 2016 commodity price rally in the context of the much bigger price decline over the last 3 years. We do this in the context of the question in everyone’s mind: is this rally a temporary bounce or the start of a more structural recovery?
The rally in perspective
The doubling in the price of oil since Q1 is less impressive in a 3 year context. The price of the key US WTI crude benchmark has risen from 26 $/bbl at its low point in February to 52 $/bbl last week. But prices remain at half of the 100+ $/bbl levels that were the norm until summer 2014. The top panel of Chart 1 shows the evolution of crude over the last 3 years.
Chart 1: WTI crude oil prices vs the CRB index & US Dollar index
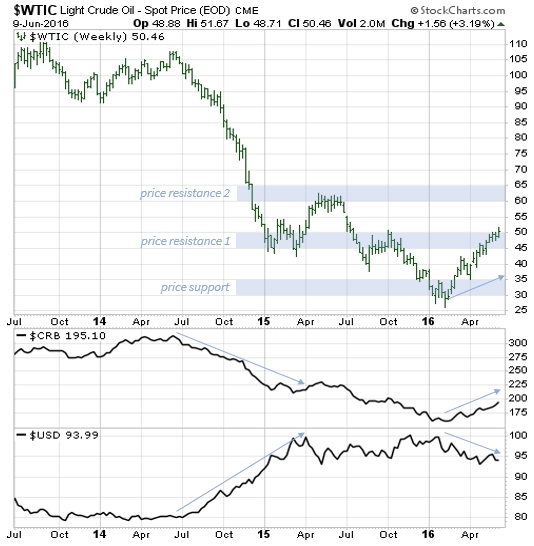
Source: stockcharts.com, Timera Energy
The two bottom panels on Chart 1 show the evolution over the same time horizon of:
- The Commodities Research Bureau (CRB) price index, the most widely followed broader global commodity price benchmark
- The US Dollar index, the most widely followed index of US dollar strength versus a trade weighted basket of currencies
We have included these indices to illustrate some key relationships:
- Oil price vs CRB index: The global slump in oil prices in 2014-15 has been accompanied by a broader correlated plunge in global commodity prices. This has reflected poorer prospects for global commodity demand, particularly due to a weakening Chinese economic outlook. Similarly, the rally in oil prices since Q1 2016 has mirrored a recovery in the broader commodity index.
- Oil price (& CRB) vs US index: We have published previous articles on the importance of the relationship between the US dollar and commodity prices. The inverse correlation between oil and the USD can clearly be seen in 2014-15. A weakening dollar in 2016 has helped support the rally in oil and other commodities. Dollar weakness this year relates primarily to the relative balance of monetary policy behind key global currencies. Despite plenty of rhetoric, Europe and Japan are failing to gain much traction with their attempts at further monetary expansion and currency depreciation. The US Federal Reserve on the other hand appears to be struggling to deliver the interest rate increases that were behind the big rally in the USD in 2014-15.
The key global macro relationships in Chart 1 do not detract from the importance of the supply and demand dynamics in individual commodity markets. But the chart does illustrate how individual market balances operate against a powerful backdrop of global economic drivers.
What next for energy prices?
We published an article in February titled 5 market surprises for 2016. Three of the potential surprises we put forward were:
- Oil prices form a multi-decade bottom
- Continental power prices also form a bottom
- The European gas market converges with Henry Hub
Its only June, but let’s do a quick status check on these.
Oil prices
The strength of the recent oil price rally suggests to us that oil prices may be forming a multi-decade low in the 25-30 $/bbl range. That does not however mean that prices rally straight back towards the Long Run Marginal Cost (LRMC) of production (e.g. 70-80 $/bbl). The crude market currently looks to be facing a stiff test of resistance in the 45-50 $/bbl range. With the US rig count rising again over the last two weeks, this level may cap the crude rally for the moment. Even If crude breaks through this level, there is more tough resistance above 60 $/bbl (as shown on Chart 1).
In fundamental terms, further recovery in the WTI price is likely to support renewed US shale drilling, with an associated increase in supply dampening prices. Until the overhang of inventories and cheap US shale is worked off, crude is likely to remain range bound at levels well below LRMC.
Coal prices
As we described above, a view on Continental power prices requires a view on coal. Much has been made of the potential for a pan-European carbon price floor (being pushed by the French). But the power price impact of this is so far a secondary consideration relative to coal. Like oil, it is hard to build a bullish case for coal in the short to medium term. But importantly the investment cycle for coal is more advanced than for gas.
Coal mines have been closing in response to weak prices (e.g. Glencore’s recent closures in Australia). In contrast, global gas supply is set to balloon over the next 3 years given the large pipeline of new liquefaction under construction. This in our view is likely to support a recovery in gas plant competitiveness versus coal plants in European power markets (another one of our 5 surprises from Feb).
Gas prices (on a relative basis)
Finally we come to gas hub prices. The recent rally in European hub prices has not significantly impacted the evolving dynamics of US vs European price convergence. In other words Henry Hub prices have rallied alongside NBP and TTF, maintaining a trans-Atlantic price spread of around 2 $/mmbtu. Convergence pressure on this spread remains as the mountain of new LNG liquefaction capacity comes to market.
This means the risk for gas prices on a relative basis over the next 3 years remains to the downside. In our view it also means it is important to challenge the portfolio exposure impacts of gas prices weakening relative to both coal and oil prices.
We will come back at the end of the year and do a ‘full time’ check on our 5 market surprises.
Written by David Stokes & Olly Spinks