Over the last five years, European coal plants have developed a substantial variable cost advantage over gas plants. This has been driven by relative weakness in coal and carbon prices over a period where gas hub prices have been supported by oil-linkage.
But coal’s competitive advantage has suffered a pronounced decline since summer 2014. A growing global oversupply of LNG and falling oil prices have driven down European gas hub prices. This is reducing the variable cost gap between gas and coal plant.
Looking ahead, this trend of increasing gas plant competitiveness may continue. Europe is set to absorb higher volumes of LNG as a market of last resort for surplus cargoes. This may tip the European gas market into pronounced oversupply. In this environment CCGTs play a key role in soaking up surplus hub gas, meaning higher plant load factors and margins.
An increase in gas plant competitiveness feeds through into higher risk adjusted asset values. CCGT assets are becoming less ‘out of the money’, increasing their ability to capture margin from power price shape and volatility. This supports an increase in asset values, even before CCGTs come back into merit on a more structural basis. In our view these are important dynamics to understand in a world where asset owners are heavily discounting the value of their CCGT portfolios.
Gas vs coal plant marginal cost
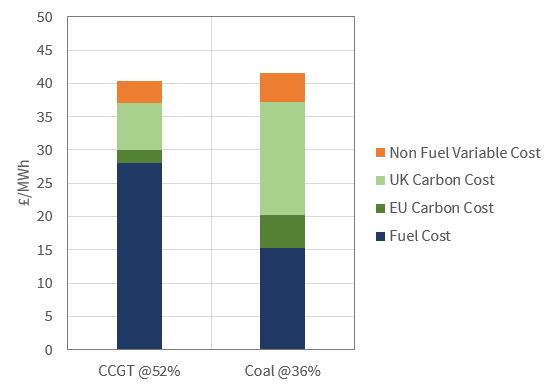
Competition between CCGTs and coal plants is driven by short run variable cost. CCGTs are more efficient and less carbon intensive, but need to burn gas (which is relatively expensive per energy unit). Coal plants are disadvantaged on an efficiency and carbon intensity basis, but benefit from cheaper per unit fuel costs. Chart 1 shows the relative composition of gas vs coal plant SRMC for the UK across the coming summer, where newer CCGTs (52% efficient) are starting to displace older coal plants (36% efficient).
We focus initially on the UK because it is the European ‘canary in the coal mine’ when it comes to gas/coal switching. This is a function of the UK’s carbon price support (now 18 £/t) and the dominance of gas in the generation mix.
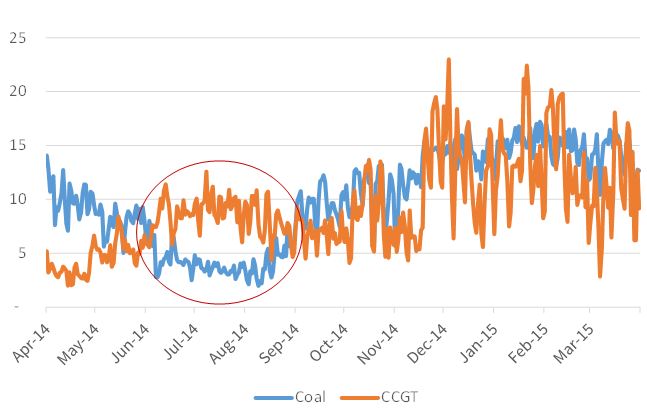
Gas vs coal switching is already a reality in the UK. Chart 2 illustrates the significant displacement of older coal plants by newer CCGTs last summer, when hub prices fell as the flow of LNG imports increased. The 2015 step up in carbon price support from 9 to 18 £/t has furthered closed the gas vs coal competitiveness gap.
Gas vs coal switching dynamics
Structural switching of coal plants for CCGTs is not yet reflected in forward market pricing, even in the UK. By structural switching we mean the return of more efficient CCGTs to baseload running as they displace coal plants. But Chart 3 illustrates that this switching point is not far away.
The chart axes show the cost of gas and coal (in traded units). The upward sloping lines show the gas & coal price boundaries for CCGT displacement of coal plants at different CCGT efficiencies:
- 52% efficiency: A benchmark for the newest plants built since 2005
- 49% efficiency: A benchmark for average system CCGT efficiency (equating to assets built around 2000)
- 47% efficiency: A benchmark for older CCGT assets (e.g. pre 1998)
Gas and coal price combinations below the upward sloping lines, favour CCGT operation over coal. Price combinations above the lines favour coal over gas.
The two clusters of coloured dots on the chart show current forward market pricing points for gas and coal over the next few seasons. CCGTs are relatively more competitive in the summer given lower seasonal gas hub prices.
While CCGTs are not yet structurally displacing coal, forward pricing over the next three summers show newer CCGTs starting to displace older coal plants. Gas plant competiveness is a lot higher than it has been over most of the last five years.
Importantly market price trends in 2015 may be moving in favour of gas plants. Hub prices remain under pressure from LNG imports, while coal prices in European currency terms have been supported by a strengthening US dollar. Europe looks particularly vulnerable to a further decline in gas hub prices this summer which may cause a significant increase in UK CCGT load factors. This may also start to increase CCGT run hours in Continental power markets.
What does this mean for gas-plant values?
The roll of CCGTs in European power markets is structurally changing as intermittent renewable capacity increases. CCGTs have become mid-merit and peaking assets. This means that CCGT asset optionality in capturing margin needs to be properly valued. The traditional Base, High & Low scenario approach to asset valuation does not do this justice, as we summarised here.
It is easy to write off CCGT asset values based on weakness in forward spark spreads. But this oversimplifies asset value dynamics. Realised asset margin capture from prompt price shape and volatility tend to increase before forward spreads react (as has been witnessed recently in the UK). And margin capture from shape and volatility is sensitive to changes in gas vs coal switching dynamics.
As the SRMC of gas plants becomes closer to that of coal plants, the number of hours of positive margin capture increases. At the same time, the costs of capturing margin tend to decrease (e.g. via a reduction in start costs and sub full load efficiency degradation). This means that plant margin increases in a non-linear relationship to gas plant competitiveness. In other words there is typically a big value difference between a gas plant running at sub 5% load factor versus one running at 30%.
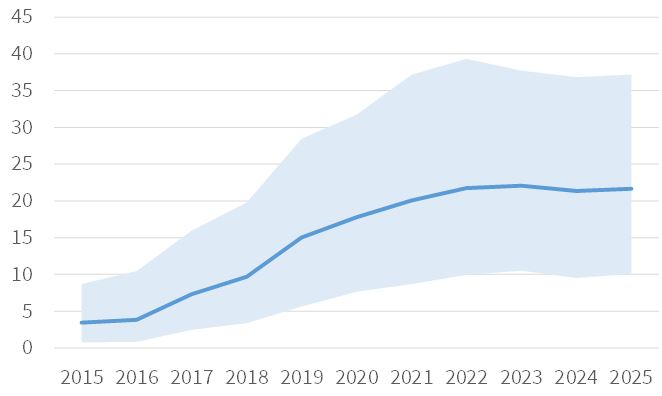
Chart 4: CCGT gross margin distribution chart (€m)
Source: Timera Energy power plant valuation model
The characteristics described above contribute to the asymmetric upside exhibited by CCGT asset margin distributions. This can be seen in the example CCGT margin distribution shown in Chart 4. The blue line shows expected asset margin, in this case increasing as gas competiveness rises over time. The shaded envelope around the expected (50th percentile) margin line reflects the 5th and 95th percentiles of the margin distribution. This margin distribution can be used to quantify the risk/return dynamics of the plant and to properly value asset optionality.
The nature of gas/coal switching and asset value
Gas vs coal switching is often perceived to be a binary affair: at the point when the SRMC of gas plants falls below that of coal plants, CCGT load factors and margins rise at the expense of coal plants. But the reality is that switching has a more gradual impact across different assets, time periods and markets.
UK CCGTs are already starting to realise the benefits of increased gas plant competitiveness. Gas plants on the Continent remain ‘out of the money’ on a forward price basis, but as hub prices fall their ability to capture margin from price shape and volatility in peak periods is increasing. These dynamics should translate into higher risk adjusted asset values. As a result, analysing how asset values can increase with gas plant competiveness is an important area of focus for gas plant owners and investors.
We will come back shortly with an expanded analysis of gas vs coal switching dynamics on the Continent.
Article written by David Stokes, Olly Spinks & Emilio Viudez Ruido