A seismic shift in commodity markets began in Q4 2014. From an energy market perspective this was focused on crude oil breaking out of its trading range above 100 $/bbl and plunging to under 50 $/bbl. But this was not an isolated oil market event. Global commodity markets have weakened in a highly correlated fashion suggesting that a bigger story is evolving. As Q4 2015 draws to a close, we take a step back to reflect on some key market benchmarks and what they may be point to in 2016.
What happened to the super-cycle?
Our first piece of evidence speaks for itself. Chart 1 shows the path of probably the most widely recognised global commodity index, the Reuters/Jefferies CRB Index.
As 2015 draws to a close, the CRB Index has broken below the level of its post-financial crisis plunge in 2008-09. In fact the commodity price index is back at the level of the 2001 trough in commodity prices (when oil prices fell under 20 $/bbl).
As striking as the absolute level of commodity prices is their rate of decline. The only commodity price fall that is comparable over the last 30 years is the 2008 collapse that followed the default of Lehman Brothers.
We have set out previously how the latest price decline has been caused by a substantial re-rating in forward projections of commodity demand, particularly in relation to China. This has been exacerbated by production development lead times, with new supply coming to market based on investment decisions made at much higher price levels several years ago.
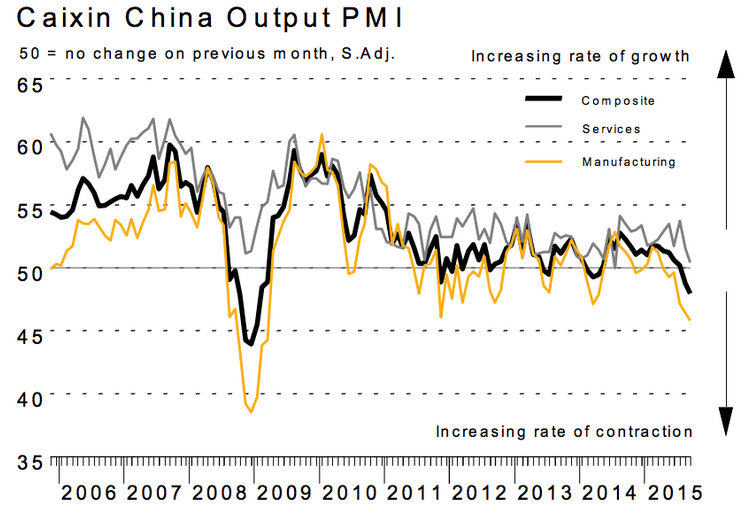
This looks like a China problem
Our second piece of evidence is a key barometer of the health of the Chinese economy. Chart 2 shows the evolution of the Chinese Purchasing Manufacturers Index (PMI). Readings below 50 represent contraction. After bumping along at low growth rates for the last four years, China’s PMI looks to be heading into a more pronounced contraction as 2015 progresses. This is particularly the case for Chinese manufacturing output which is of key importance for commodity demand.
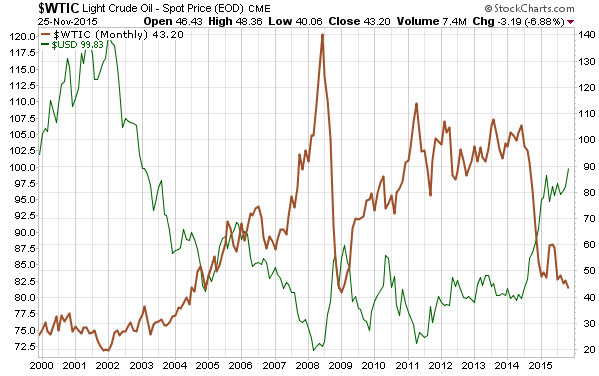
Strengthening USD undermines a commodity price recovery
Our third exhibit relates to currency movements and their impact on commodity prices, specifically in relation to the US Dollar (USD). We described the key negative correlation between commodity prices and the USD in a previous article this year. This is illustrated in Chart 3 which shows an overlay of the USD Index versus front month WTI crude prices since 2000.
The chart shows that the sharp decline in crude prices in Q4 2014 coincided with a rapid strengthening of the USD against other major global currencies, most importantly the Euro. USD strength against the Euro in late 2014 was driven by the ramp up of European quantitative easing to support weakening economies, against a backdrop of a relatively resilient US economy.
Chart 3 shows the USD starting to rise sharply again in Q4 this year, reflecting expectations for ‘more of the same’. The US Federal Reserve now looks likely to embark on a rate hike cycle starting in December. But the European Central Bank appears increasingly inclined to move in the opposite direction, with more monetary easing on the horizon in 2016. If the USD continues to strengthen into 2016 it will provide strong headwinds for any recovery in commodity prices.
Looking ahead to 2016
The three charts above paint a pretty pessimistic picture of commodity prices heading into 2016. In fact together they present a reasonably compelling case for commodity price weakness to continue in 2016. But there are strong self correcting forces that tend to drive the cyclical behaviour of commodity markets.
Demand response to lower commodity prices is an important factor to watch. Future resource requirements can now be sourced at a fraction of the cost of even early last year. Ultimately sharp commodity price declines are supportive of economic growth in manufacturing intensive economies such as China and India. On the supply side, falling prices are choking off investment in new capacity. These factors are likely to form the foundations of the next cyclical recovery in commodity prices. But this may take some patience beyond 2016.
Next week we return to take a closer look at global gas pricing dynamics heading into 2016.
Article written by David Stokes & Olly Spinks