Trading liquidity is the oxygen that is supporting the evolution of Europe’s gas hubs. Liquidity growth has been self reinforcing. With higher transaction volumes, price transparency increases and transaction costs decrease. This increases the attractiveness and reliability of hubs as a means to manage gas portfolio hedging and optimisation.
Some strong trends have emerged as hub liquidity has grown over the last decade. European gas trading has evolved around the UK NBP and Dutch TTF virtual trading points. While prompt liquidity has emerged at a number of other locations (e.g. Zeebrugge, NCG, Gaspool, PEG, PSV), forward liquidity remains focused on NBP and TTF. This is a function of the strength of price convergence across European hubs (illustrated in Chart 1).
Chart 1: Month-Ahead price evolution at major European gas hubs
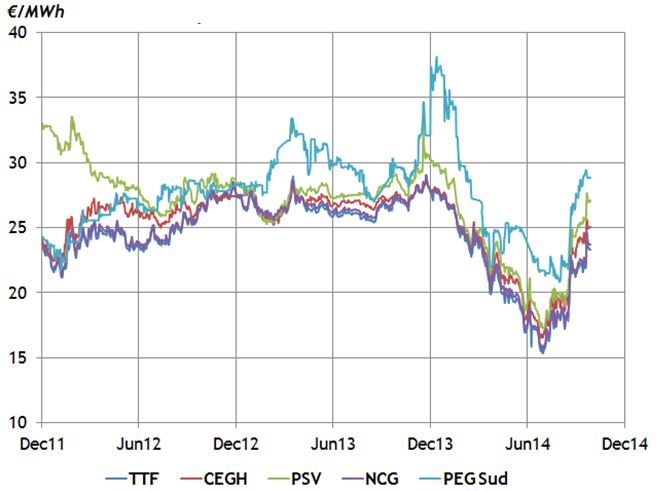
Source: Timera Energy (LEBA prices)
Prices between the different Continental hubs can diverge over the shorter term (e.g. within-month) as a result of locational supply and demand factors (e.g. weather, LNG flow). But structural divergences in prices beyond the prompt horizon are rare (with the notable exception of the French PEG Sud and Spanish AOC hubs). There has been a particularly strong correlation between TTF and the important German NCG hub.
This has reinforced the focus on TTF as the hub of choice for forward trading. TTF liquidity has also been helped by relatively low trading costs (e.g. narrow bid/offer spreads and exchange trading fees) and a greater range of tradable products that help the portfolio exposure management and asset monetisation. Forward portfolio exposures are mainly hedged against TTF with locational basis risk managed via prompt trading at other hubs.
The dominance of TTF as the most liquid Continental hub is illustrated clearly in Chart 2 which shows the evolution of traded volumes over recent history. While volumes at other Continental hubs have expanded, they are small relative to TTF given the focus of trading on prompt portfolio optimisation.
Chart 2: Liquidity evolution at major European hubs

Source: Quarterly Report on European Gas Markets (Vol 7) - European Commission
Since the onset of the financial crisis in 2008, European hub liquidity has almost doubled. Liquidity evolution was given a big boost by the 2009-10 global gas glut period of oversupply. This was the result of two main factors:
- As hub prices fell below oil-indexed contract levels, suppliers were strongly incentivised to use cheaper hub gas in their portfolios wherever possible.
- Surplus LNG supply flowed into Europe as a market that offered a relatively robust price signal and forward liquidity to support cargo sales.
These factors are again at work as the global gas market balance has shifted back towards oversupply in 2014.
A pronounced increase in traded volumes can be seen in Q1 and Q2 2014 in Chart 2. This period coincides with an increase in the flow of spot LNG cargoes to Europe as Asian spot prices have declined. It is also a period over which European hub prices have fallen sharply below oil-indexed contract strike prices. If the gas market is transitioning towards a period of oversupply, these factors are likely to support further growth in hub liquidity.