The global gas market balance has swung from Asia back towards Europe as oversupply in the LNG market has taken hold. European hubs are providing key global price support as a market of last resort for surplus LNG flows. But how much surplus LNG can Europe absorb without driving hub prices sharply lower?
The ability of European hubs to absorb LNG is driven primarily by supplier flexibility to ramp down pipeline contract volume to take or pay levels. But at the point that contract swing flexibility is exhausted, hub prices may disconnect from oil-indexed contract prices and fall substantially, firstly to levels that induce gas vs coal switching in European power markets and then ultimately towards price support from Henry Hub (as was the case in 2008-09). This is what we refer to as the tipping point.
Current global balance
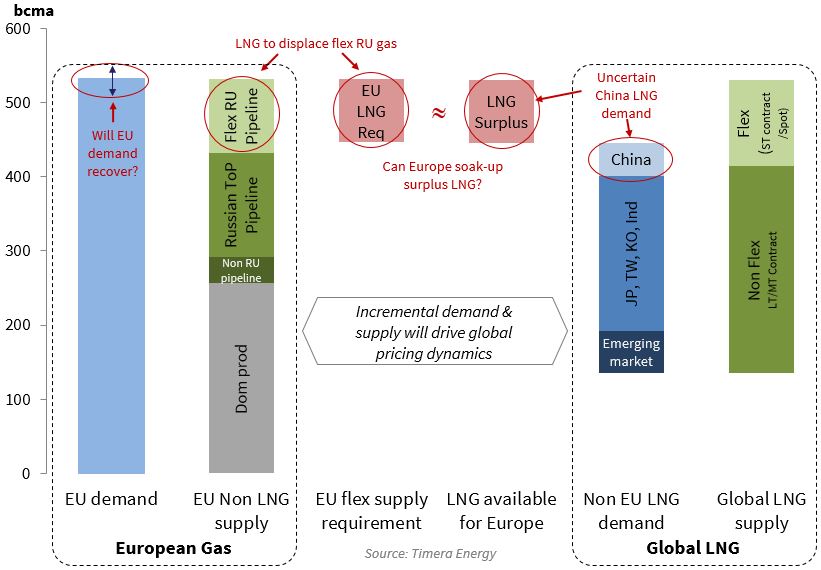
Forward market prices do not yet anticipate this ‘tipping point’ being reached. Forward hub prices remain broadly in line with oil-indexed contract price proxies. But the global market currently looks to be finely balanced. In Chart 1 we show our summary view of the supply and demand balance in the European vs global LNG market for 2016.
The left hand side of the chart shows the supply and demand balance at European hubs. The right hand side of the chart shows the global LNG market balance. LNG supply in excess of Asian demand (and the relatively small non-Asian emerging market demand), will need to be absorbed by Europe.
Some of this European volume is via non-divertible LNG supply contracts, primarily into Southern Europe. But as new volumes of LNG liquefaction capacity are commissioned in 2015 and 2016 they look to be exacerbating the oversupply situation in Asia. Under conditions of oversupply, divertible European LNG contracts and surplus spot LNG cargoes will flow into European hubs.
The ability for European hubs to absorb surplus LNG volumes is driven primarily by the displacement of flexible pipeline contract volumes, most of which come from Russia. As surplus LNG flows act to push hub prices below oil-indexed strike prices, suppliers are incentivised to minimise pipeline contract volumes to the annual contract ‘take or pay’ (ToP) levels.
Chart 1 illustrates the volume of pipeline swing contract flexibility above ToP. Swing flexibility has traditionally been about 85% of annual contract volume. However suppliers have negotiated additional ToP flexibility through contract reopener processes over the last 5 years, although it is difficult to know exactly how much given confidentiality of negotiations.
The important thing to note is that with swing flexibility around this level, European hubs do not appear to be far from the tipping point we describe above. This tipping point could be tested over the next two years if European and Asian gas demand remains soft in the face of the rapid ramp up in new LNG supply.
A simple European supply stack view
There has been a rapid transition in European hub pricing over the last six months as crude prices have fallen and European LNG imports have increased. These conditions warrant revisiting our framework for analysing European hub prices, to gain some perspective on how prices may evolve going forward.
The purpose of our hub pricing framework is to simplify the complex interaction between sources of supply and demand that drive European hub pricing dynamics. As summarised in our previous article:
There are two important considerations that can be used to greatly simplify the problem:
- Grouping sources of supply with similar pricing and flow dynamics
- Focusing on the flexible volumes of gas that drive hub pricing at the margin (i.e. around the intersection of supply and demand)
The first of these tasks is helped by the fact that most sources of European supply are under long term contracts that use a similar structure. The second task is assisted by the fact that only a relatively small volume of total European supply actually has the flexibility to respond to changes in market price.
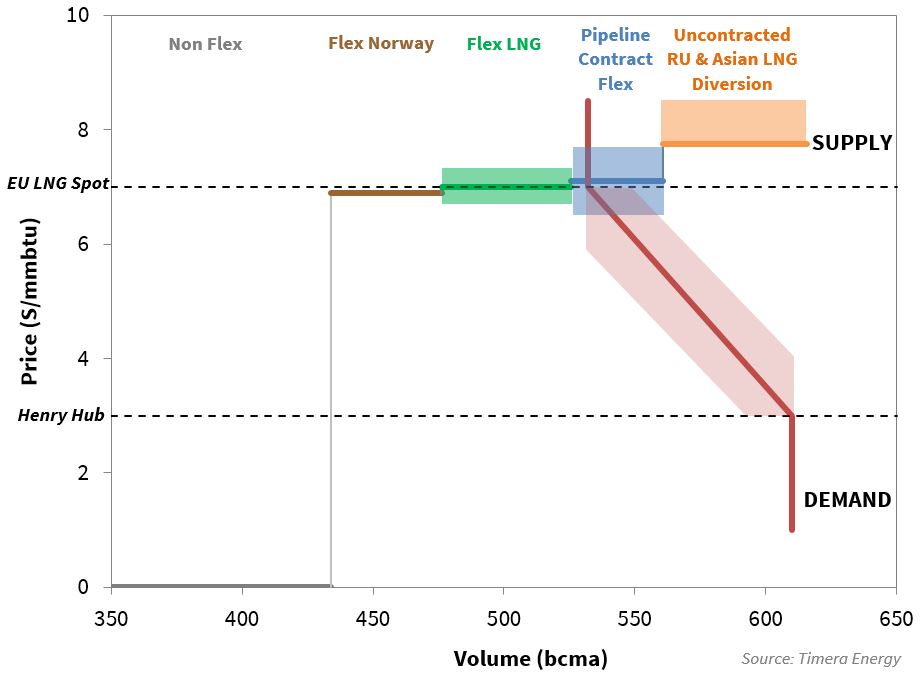
Chart 2 illustrates the key tranches of supply that are currently interacting to set hub prices at the margin. It is important to note that the chart contains a simplified view of both supply and demand, in order to get across the key concepts. It should also be noted that inflexible ‘must flow’ volumes of gas (e.g. domestic production and contracted ToP volumes) are assumed to sit to the left of the supply stack at zero price.
The demand curve (in red) shows a simplified representation of pan-European gas demand in 2016. Projected demand at current price levels is around 530 bcm. The demand curve is downward sloping at lower price levels. This is driven primarily by an increase in gas demand as coal plant output switches to gas plant output as gas prices fall. The shaded red range around the demand curve reflects uncertainty around factors that influence demand such as coal price levels. The Henry Hub price level represents a floor price for European hubs given the US gas market can ultimately assume the role of LNG market ‘sink’ for surplus cargoes (as it did in 2008-09), although this situation may act to push US gas prices lower.
We have simplified pan-European supply by grouping flexible sources of gas into four main tranches as set out in the table below (again more logic here in our previous article). This provides a basic view of supply source interaction which is enough to describe key hub pricing dynamics. This can then be enhanced relatively easily by adding more detail on volume and pricing as required (e.g. sub-tranches of supply).
This simplified annual supply stack view provides a useful summary of some of the key drivers of hub price evolution given current market balance. While it is easier to observe these dynamics at an annual level, there are more complex dynamics at work behind this at a sub-annual level (e.g. seasonal price & flow behaviour). A particularly important dynamic here is the fact that there is additional within year flexibility in swing contracts (over and above the annual flex above ToP levels shown in the chart). These sub-annual dynamics do not invalidate conclusions at an annual level, but are important to bear in mind.
Conclusions on price dynamics
The price declines at European gas hubs over the last six months have been consistent with the fall in oil prices. In other words gas hub prices have remained broadly linked to long term oil-indexed contract prices. But this linkage is threatened by a limited volume of swing contract flexibility which can be displaced in order for hubs to absorb higher LNG inflows. At the point that contract swing flexibility is exhausted, hub price levels can disconnect from oil-indexed contract prices. At this tipping point, prices may fall sharply lower to levels that support the increase in demand required to absorb higher LNG inflows.
The supply stack in Chart 2 highlights the two key tranches of gas supply that will determine whether the European gas market reaches its tipping point. At current hub price levels (~7 $/mmbtu), European hubs cannot absorb both flexible LNG imports (the green tranche) and significant volumes of swing contract volumes above ‘take or pay’ levels (the blue tranche). This leads to the conclusion that increasing LNG inflows are likely to ensure that hub prices remain below oil-indexed contract price levels (i.e. flexible LNG will sit below swing gas in the supply stack).
Once European swing contract flex has been fully displaced by higher LNG imports, tipping point dynamics are driven by price inelastic volumes of demand and supply. Surplus LNG supply sold into Europe as a market of last resort is relatively insensitive to hub price levels. LNG will flow into Europe as long as NBP/TTF prices are more attractive than LNG spot price alternatives (e.g. in Asia). Similarly it may take significant gas price falls to induce higher European hub demand from gas vs coal plant switching. The inelasticity of these supply and demand volumes is an important factor that can drive sharp moves lower in hub prices.
The evolution of overall European gas demand levels will also be a key determinant of whether hubs reach the tipping point. If medium term demand is lower than the levels we have assumed, due to weather, continued economic stagnation, further general erosion of power sector gas burn by coal and renewables, this reduces the scope for European hubs to absorb LNG imports while meeting Russian take-or-pay volumes. This underlines the importance of keeping the assumptions within this framework refreshed as views of European demand change.
If Asian LNG demand remains weak over the next two years, the tipping point dynamics we describe in this article may take center stage. Global liquefaction capacity is set to increase by 55 bcma by the end of 2016. If a significant volume of that increase in LNG supply flows into Europe, it will test the ability of European hubs to ramp down swing contract take in order to absorb increasing LNG inflows. Under these conditions, the switching of coal for gas plant in the power sector will become a key driver of marginal hub pricing dynamics. We will come back shortly to focus on a more detailed analysis of coal vs gas switching dynamics.
Global LNG and European gas workshop
Timera Energy offers tailored workshops exploring the evolution of the global LNG and European gas market fundamentals and pricing dynamics. These workshops involve Howard Rogers who, as the Director of the Gas Programme at the Oxford Institute for Energy Studies, is acknowledged as a leading industry expert in the global gas market.
If you are interested in more details please email olly.spinks@timera-energy.com
This article was written by David Stokes, Olly Spinks and Howard Rogers


