A number of interesting dynamics have emerged in the European gas market over the last twelve months.
On the supply side, relatively low LNG import volumes have been offset by higher Russian flow volumes. This has been pitched as round one in a multi-year Russian vs LNG import battle for European market share.
On the demand side, European gas consumption recovered in 2016, driven by a sharp increase in power sector gas demand and the onset of a cold winter.
It may be tempting to try understand the drivers of each of these developments in relative isolation. But the events of the last year can to a large extent be explained by the evolution of market pricing dynamics.
Last week we explored the relationship between European hub and spot LNG prices. In today’s article we look at the key relationships between:
- European gas and oil prices, driving long term gas contract flow volumes
- European gas and coal prices, impacting power sector gas demand
These three relationships are key indicators on our European gas market ‘dashboard’. They provide an insight into both the historical evolution of market conditions as well as guidance on the future direction of flows and pricing.
Revisiting the key price benchmarks that drive European hubs
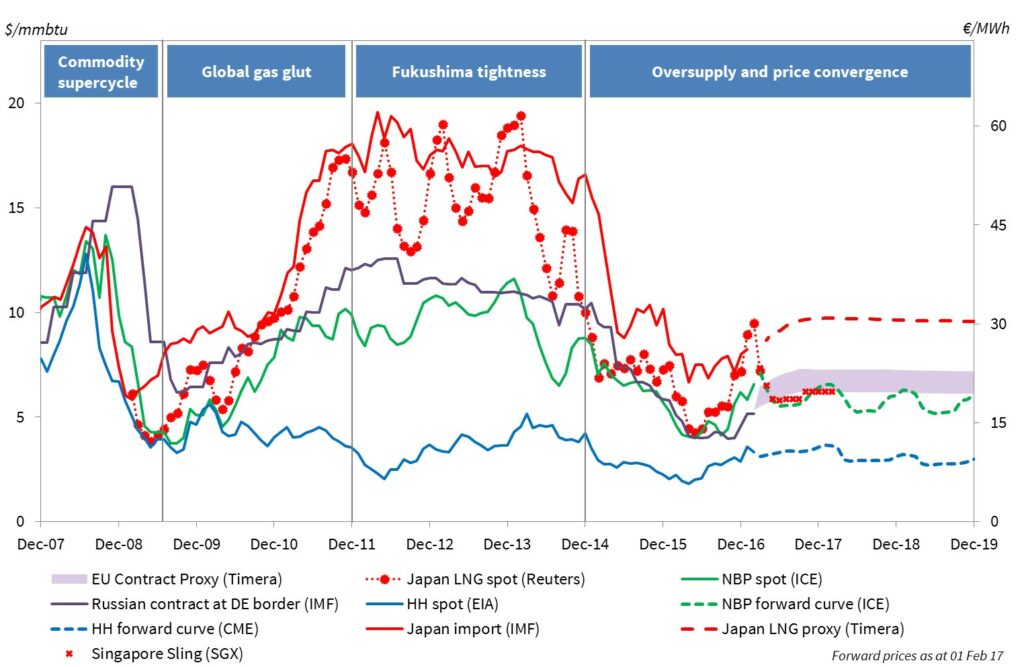
Chart 1 summarises the evolution of hub prices in the context of the last 10 years of history, as well as providing a current snapshot of forward market pricing.
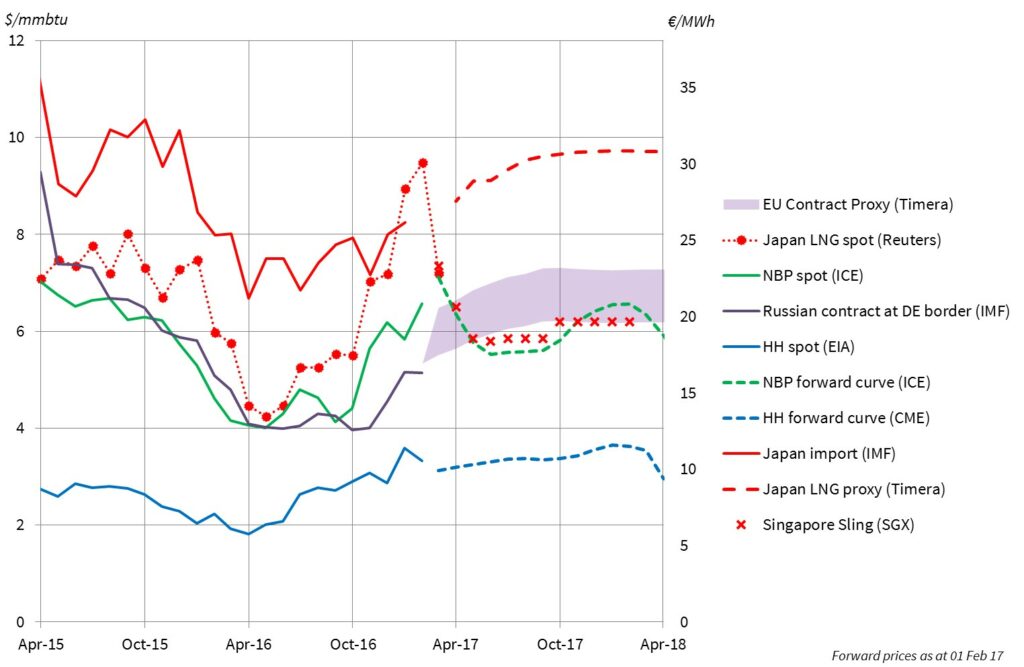
Chart 2 then shows a blown up view of recent history and forward market benchmarks over the next 12 months.
Some important observations from Chart 2:
- Q1 slump: European hub prices, Asian spot LNG and Russian oil-index contract prices all fell sharply in Q1 2016 towards 4 $/mmbtu. This happened in parallel to a global commodity price slump.
- Oil & coal recovery: Oil and coal prices commenced a pronounced recovery in Q2 that carried through to Q4, with the prices of both commodities roughly doubling from their lowest levels. Coal prices played a key role in influencing European hub prices in late 2016 as we discuss below.
- LT contract prices: The prices of long term oil-indexed supply contracts remained relatively weak across 2016, driven by the 6-9 month time lag in indexation to crude prices.
- Q4 rally: Hub prices rallied sharply in Q4 back to 6 $/mmbtu, alongside rising Asian spot LNG prices as the winter set in. This opened up a significant premium of hub prices over oil-indexed contract prices.
We now map these pricing dynamics on to some of the key supply and demand events on 2016.
Is Russia making a grab for market share?
European import volumes from Russia were strong in 2016, at 179 bcm (an approximately 34% market share). This can be compared to a recent historical average closer to 150 bcma.
LNG imports on the other hand were lower than expected, despite the commissioning of significant volumes of new global liquefaction capacity. In January we summarised the outage issues and liquefaction ramping delays that have somewhat curtailed volumes of new LNG supply.
As a result of robust export volumes, Gazprom has been quick to claim round one in its fight for market share against LNG. But the reality is a more complex function of exercise decisions on long term contract volumes.
The flow decisions on the large majority of Russian gas imports, sits with suppliers via long term contract exercise rights. The big boost in Russian import volumes in 2016 came in Q4. Chart 2 illustrates why suppliers nominated high volumes in Q4, given the substantial discount of oil-indexed contract prices relative to hub price alternatives. At the same time, stronger Asian demand was causing LNG cargoes to be diverted away from Europe.
Gazprom may be becoming more assertive in its attempts to grow European market share. But its ability to do this in 2016 had a lot to do with the evolution of hub prices relative to oil and Asian LNG prices. Those tailwinds look to be weakening in 2017.
Gas vs coal switching becomes a reality
A cold start to the current winter helped to support gas demand in Q4 2016. But the primary driver of a recovery in European gas demand relative to 2015 was a sharp increase in power sector gas demand.
Gas demand from European power plants rose by approximately 20 bcm relative to 2015, as CCGTs ran at higher load factors. The key driver of higher gas plant burn was a shift in relative gas vs coal prices.
As 2016 progressed, coal prices surged relative to European gas prices. This meant that CCGTs were more competitive on a variable cost basis, supporting run hours. The coal price surge played an important and underappreciated role in supporting European hub prices in 2016.
Coal prices roughly doubled between Q1 and Q4 2016. This significantly lifted the switching boundaries at which CCGTs displaced coal plants, particularly in UK power market with its carbon price floor. In other words the rise in coal plant variable costs meant that price support from the power sector materialised at higher gas price levels.
Power sector gas demand was particularly strong in Q4 2016, as coal prices surged towards 100 $/t and French nuclear outages were backfilled by CCGTs. This also contributed to the Q4 rally in hub prices that can been seen in Chart 1.
Looking forward into 2017
European hub prices have remained supported into Q1 2017 by ongoing cold weather and relatively low storage inventories. But prices have started to decline in February as regional LNG spot prices have re-converged with North-West European hubs. There looks to be an associated increase in LNG cargoes heading for Europe.
The big rally in oil prices in the second half of 2016 is starting to feed through long term contract price index lags. The effect of this can be seen in Chart 2, with the Russian oil-indexed contract price benchmark rising sharply in Q1 2017.
However current forward market prices suggests that hub gas will once again become cheaper than oil-indexed contracts in Q2. So Russian import volumes are likely to be robust in Q1 2017, but relative pricing dynamics may shift against Russian gas flows as the year progresses. The spread of Asian spot LNG prices over European hubs will also be an important factor to watch as an indication of LNG market tightness.
The key gas demand question for 2017 is to what extent power sector consumption continues to recover. The barometer for further gas for coal switching in 2017 is the relative levels of gas versus coal prices. European coal prices have fallen back from their peak in Q4 2016, but remain elevated (API2 currently around 77 $/t). The extent to which gas hub prices fall into the summer will be an important driver of the relative competitiveness of CCGTs.
We will keep an eye on the key relative price relationships covered in this article as the year progresses.
Article written by David Stokes, Olly Spinks & Howard Rogers