The decline in crude prices that started last summer has been one of the sharpest selloffs in the history of the oil market. After stabilising towards the end of Q1 2015, crude prices have recovered in Q2. There are two schools of thought as to the meaning of this price rally:
-
- Correction: After a sharp move lower in crude prices, the recent rally is a temporary correction before prices fall again.
- New trend: The Q2 rally is the start of a more structural recovery in oil prices as supply has been curtailed by lower prices.
We subscribe to the former view. But whatever your view is on the oil market, it is worth considering the relationship between crude and the US dollar (USD). There is currently an important set of fundamental drivers, focused around US shale oil production, which is unique to the oil market. But the strength of the inverse relationship between the USD and crude prices provides a useful directional barometer.
Important price relationships
Global commodities are traded in US dollar terms. This supports a strong inverse relationship between commodities (priced in USD) and the strength of the USD itself (e.g. against a basket of other currencies).
This relationship does not just reflect basic arithmetic (i.e. a rising denominator). The oil price has fallen substantially in EUR terms, even though the EUR has also fallen against the USD. A rising US dollar tends to reflect a fundamental environment that is less favourable for commodity prices. For example, increasing US interest rates, a tightening of credit conditions and a general rise in market risk aversion.
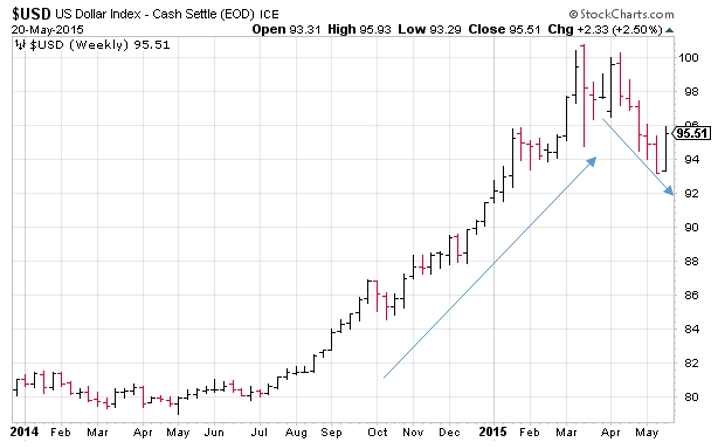
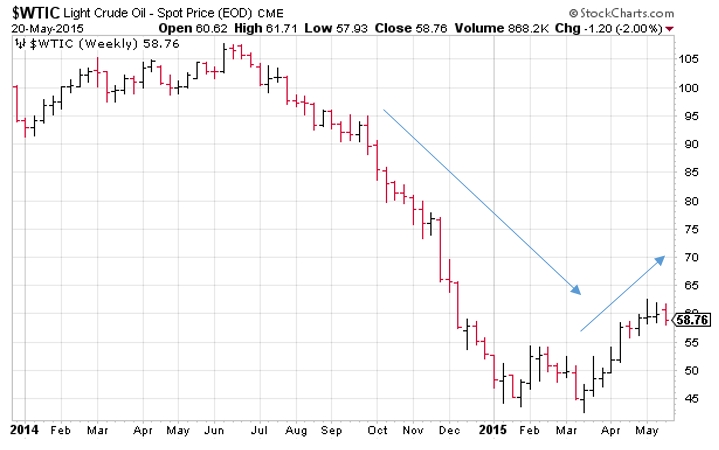
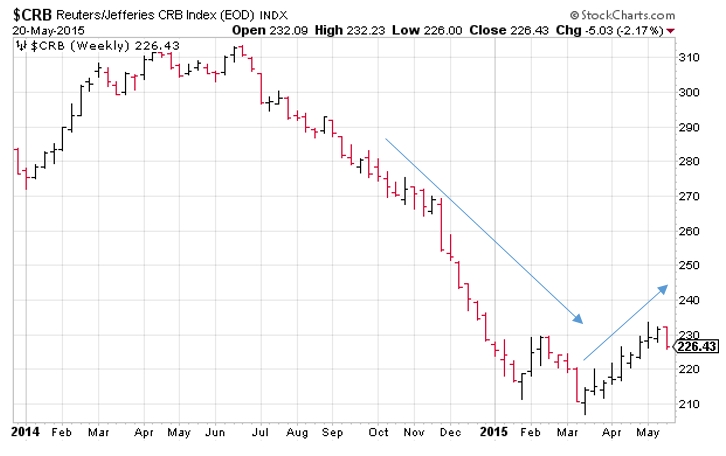
The extent of the relationship between the USD, crude and a basket of all commodities (the CRB index) is illustrated in Charts 1, 2 and 3 respectively.
Q3 2014 – Q1 2015: The sharpest rally in the USD in 30 years commenced in the summer of 2014. This was the same point in time at which crude began to fall. And crude prices were accompanied lower by other commodities (e.g. metals, agriculture).
Q2 2015: The peak of the USD rally towards the end of Q1 coincided with the bottoming of crude prices and those of other commodities. Through Q2, prices of oil (& other commodities) have recovered as the USD has weakened in a sharp counter trend move.
Q3 2015+: History shows that major currency trends tend to last significantly longer than 9 months. These trends tend to reflect structural macro drivers (e.g. a strengthening of US interest rates vs Europe and Asia) that can often last several years. This suggests that the Q2 weakness in the USD, and in turn the recovery in crude, is a temporary correction.
Back to the fundamentals
From the lowest price this year (around 42 $/bbl), front month WTI crude prices have recovered 50% to above 60 $/bbl. Over this period, the tail of the WTI crude curve has moved back up towards 70 $/bbl. This is an important level because it represents the lower bound of long run marginal cost (LRMC) benchmarks for investment in new US shale production.
The relatively short well life cycle of US shale means that the LRMC of new production is very important in driving US production volumes, as we set out here. The impact of the recent crude curve fall on investment in new US oil wells can be seen via the declining US rig count shown in Chart 4 (the red line).
But throughout the price decline of the last 9 months, crude prices have remained above the short run marginal cost (SRMC) of production for existing wells. This has led to a steady increase in US oil production, despite lower prices (the blue line in Chart 4).
Chart 4: US oil production vs rig count

Source: Carpe Diem Blog, EIA, Baker Hughes
The recent rig count declines will start to impact US crude production going forward, although the fall in rig numbers is to some extent being offset by an increase in rig productivity. But this rig count decline will likely stabilise or even reverse if forward crude prices reach levels that again cover the LRMC of drilling new wells.
The way forward
The ongoing increase in US production and the fact that WTI prices are approaching LRMC benchmarks for new investment, suggests to us that the recent rally in oil prices may not have much further to run. If this is correct then the USD is likely to provide a useful indicator as to the next move lower in crude prices. If the USD resumes its climb then oil prices will likely face strong headwinds.
Production cost drivers point towards higher oil prices in the long term (e.g. 2020+). For example the LRMC of new deepwater and oil sands production investments is significantly higher than current crude price levels. But the evolution of oil prices in the short to medium term is likely to remain focused on US shale production. In our view, a longer period of lower prices is required to interrupt the US shale production investment cycle.