The global gas market has been turned on its head over the last 18 months. In Q1 last year, Asian spot LNG prices were breaking records with the Platts JKM marker above 20 $/mmbtu. Behind this was a structural divergence across regional gas prices in Asia, Europe and the US, with flexible LNG supply diverted to Asia to cash in on premium prices. The market consensus view was that market tightness and higher gas prices were here to stay.
Fast forward to Q4 2015 and global gas prices have slumped. Asian and European prices have rapidly converged in a relatively tight range above 6 $/MMBtu. US gas prices remain below 3 $/mmbtu, but the price differential between the US and Europe is gradually being eroded by oversupply. The approaching northern winter, usually a driver of higher seasonal prices, has failed to have an impact so far.
We pointed to the start of a new phase of global gas market oversupply in September 2014. But what are the drivers that are going to determine the dynamics and duration of this new phase and the evolution of gas prices into next decade? We set out the five key factors that we are watching below.
1. Impact of crude pricing
Oil-indexation remains a powerful influence on European and Asian gas prices. In Asia, almost all LNG contract volumes are indexed to crude benchmarks (e.g. JCC, Brent). In Europe, despite a much publicised trend towards the spot indexation of gas, the majority of long term pipeline swing contracts also remain indexed to oil (primarily gas oil & fuel oil) – albeit moderated via price formula concessions and rebates which have become prevalent post 2008
Oil-indexation has a particularly important influence on spot prices in Asia and Europe because of its influence on the exercise of contract volume flexibility. The ability to vary swing contract take is optimised based on the differential between oil-indexed contract prices and spot gas prices. When spot gas is cheaper than oil-indexed contract prices, contract volume take is reduced (and vice versa).
This means that oil-indexed contract prices act as an important longer term anchor for gas prices. This relationship is a loose one over a shorter term horizon given the influence of other supply and demand factors. But oil-indexed prices act as a ‘magnetic ceiling’ and typically draw spot gas prices back in line in a reasonably balanced market. That said, a very tight market can see spot gas prices ‘break through’ this ceiling (UK in 2005/2006) although such occurrences are rare and transitory. Alternatively an oversupplied spot market can see hub prices disconnect below contract prices (e.g. as in 2009-10).
On this basis, the length and depth of the current decline in oil prices is a key factor that will determine how gas prices behave into next decade. We have recently set out our view on oil prices. Crude prices should recover over time given they are currently well below LRMC benchmarks. But there may first need to be a period of lower prices to interrupt the US shale oil investment cycle.
2. Asian LNG Demand
Asia represents the main source of uncertainty on the demand side of the global gas market. In summary across the large and growing Asian gas consumers:
- Japan: Lack of clarity on the pace and scale of nuclear restarts
- South Korea: Uncertainty around gas vs coal usage in the power sector
- India: Questions over infrastructure, domestic pricing and affordability of gas vs coal
That leaves the most important market China. The key source of uncertainty around Chinese demand is the scale of potential demand growth. China’s LNG requirements are the ‘balance’ required after:
- Domestic production (uncertain volumes of conventional, shale, coal bed methane and syngas from coal)
- Pipeline Imports from Turkmenistan, Central Asia & Myanmar
- Russian pipeline gas from Siberia
We know demand growth will be large. But the difference between large and very large has a substantial impact on the global gas demand. It is also unclear how Asian demand (particularly from buyers with lower contract cover like China and India) will respond to lower spot LNG prices. We illustrate the uncertainty around Chinese LNG demand via an illustrative ‘high’ and ‘low’ LNG demand growth case in Chart 1.
Chart 1: Asian LNG demand growth scenarios
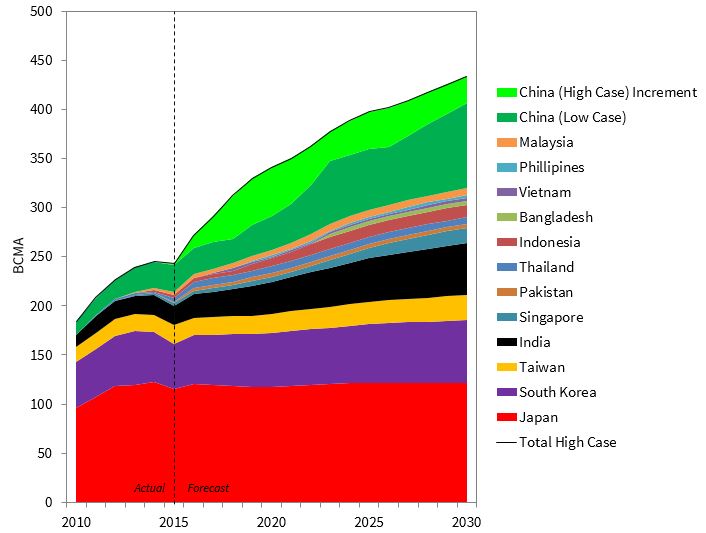
Source: Howard Rogers OIES
3. European demand recovery
European gas demand has fallen almost 20% this decade. Around half of this decline occurred in 2014 due to an outlier warm weather year across Europe. Weather normalisation aside the main drivers of the evolution of European demand are the rate of economic growth and the extent to which there is a recovery in gas fired power plant load factors.
Two illustrative scenarios are shown for ‘steady’ vs ‘low’ gas demand growth in Chart 2.
Chart 2: Illustrative European gas demand evolution scenarios (includes Turkey)

Source: Howard Rogers OIES, Timera Energy
The ‘steady’ growth scenario assumes:
- Some SRMC driven coal gas switching as gas hub prices fall (particularly in UK)
- Emissions legislation driven retirement of coal plant (LPCD & IED)
- Planned retirement of nuclear plants (Germany important)
- A slowdown in renewable investment over the next decade
The ‘low’ case assumes:
- Coal remains ahead of gas in merit order
- Some coal & nuclear retirements delayed
- Renewables investment pace maintained
- No effective carbon pricing mechanism
The more than 100 bcma difference in demand by 2030 illustrates the uncertainty involved.
4. Impact of new liquefaction capacity
There is more than 150 bcma of liquefaction capacity that has already reached Final Investment Decision (FID) sign off and is set to be built by the end of the decade. 140 bcma of projects are already under construction, with more than 55 bcma due to be commissioned by the end of 2016, across Australia, Malaysia, Indonesia and the first US export trains at Sabine Pass.
We have written in some detail about the mountain of new LNG liquefaction capacity that is being developed. So we won’t labour the point in this article. But suffice to say that current oversupply in the global gas market is in large part due to the overhang of committed new capacity.
5. Russian response to oversupply
There is no OPEC in the gas market. But Russia is certainly large enough to influence the global market balance. Particularly important will be how Russian producers (primarily Gazprom) react to the growing global oversupply of gas.
The challenge Russia faces can be broken down into two key Issues:
- Russia’s price / volume strategy in Europe
- Russia’s influence on timing of new LNG project investment decisions
As global LNG supply increases, European LNG imports are set to rise as Europe’s hubs absorb gas as a market of last resort. These import volumes have the potential to push global gas prices down towards US Henry Hub levels. But Russia has the ability to support hub prices via influencing the volume of gas it sells into Europe. It can achieve this via granting a range of (likely temporary) concessions on its contract prices (as seen in 2011-13). This Russian price/volume strategy may be a key factor determining how deep and prolonged the current price slump will be.
Looking into next decade, as the surge in Australian & US LNG exports is absorbed, the global gas market will tighten again and hub prices in Europe will rise. This leaves Russia with an important longer term strategic challenge:
- If Gazprom allows hubs to exceed $9 to $10/mmbtu, new LNG projects will achieve FID. Once launched the SRMC on these projects is very low.
- If Gazprom increases exports to keep European hubs below $9 to $10/mmbtu, new LNG FID’s will be delayed. This would appear to be sensible strategic behaviour but may be hard to sustain, particularly in a world of significant oil price recovery.
Making sense of the global gas market
In our view there is little merit in trying to analyse the global gas market on a ‘bottom up’ basis (i.e. by trying to build up a robust view of all individual sources of supply and demand). Changes in the 5 key factors set out above mean that analysis at this level of detail is spurious at best.
Instead we take a ‘top down’ scenario based approach where we group key tranches of global supply and demand. We focus particularly on:
- the key tranches of flexible supply that drive marginal pricing
- the interaction between prices across different regions to clear the global market
- potential ranges in the evolution of demand by region
- the overlay of strategic considerations from large market players with pricing power (e.g. Russia and China)
The attraction of this approach is it is easily digestible and transparent. But our analysis points to the fact that the influence of Russian strategic decisions are more important than is often recognised. So in an article to follow shortly, we will return and explore Russian price/volume strategy in more detail.
Global LNG and European gas workshop
Timera Energy offers tailored workshops exploring the evolution of the global LNG and European gas market fundamentals and pricing dynamics. These workshops involve Howard Rogers who, as the Director of the Gas Programme at the Oxford Institute for Energy Studies, is acknowledged as a leading industry expert in the global gas market.
If you are interested in more details please email olly.spinks@timera-energy.com
Article written by David Stokes, Howard Rogers & Olly Spinks