The displacement of coal plant by gas plant is one of the key current focus issues in the European energy industry. A sharp decline in coal prices from 2010 to 2014 drove much of Europe’s gas fired capacity out of merit. But gas plants have started to make a comeback in 2016. Falling gas hub prices are favouring CCGTs over coal plants and some of the coal for gas switching from earlier this decade is beginning to reverse.
Gas vs coal switching is an issue that spans gas and power markets in Europe. Switching is an important driver of power prices, load factors and generation margins in power markets. But it also determines the level of incremental gas demand from the power sector as hub prices decline. In other words it is the primary driver of the shape of the demand curve for the European gas market. As such, it is also important in a global LNG market context given switching is playing an important role in stemming the decline in NBP/TTF gas prices towards Henry Hub.
While the role of switching is being widely debated across the industry, there is less clarity around the practical impact of switching on volumes and prices. So we are publishing a numerical analysis of European gas vs coal switching potential in a two article series. This week we address the dynamics that drive switching and set out the key power markets involved. Then next week we analyse aggregate switching volumes across Europe, given different levels of gas and coal prices.
The drivers of power sector switching
There are several important factors that determine the contribution of individual power markets to Europe’s aggregate switching potential:
Market size: The scale of generation output in the market is clearly a defining factor. This means a focus on the larger power markets in Western Europe.
Gas capacity: The volume of installed gas-fired generation capacity is one factor determining potential gas burn.
Coal capacity: The other side of the switching equation is determined by the volume of installed coal capacity which impacts the degree to which substitution is possible.
Gas plant responsiveness: The existence of significant volumes of gas and coal capacity does not on its own determine switching potential. The role of gas plant in the merit order and the responsiveness of gas burn to changes in fuel prices is an important overlay. Other considerations such as the range of gas plant efficiency and volumes of must run renewable & CHP output also need to be accounted for.
The ability of gas plant to respond to market price changes is the most important dynamic impacting current switching dynamics. This is best illustrated via two practical examples.
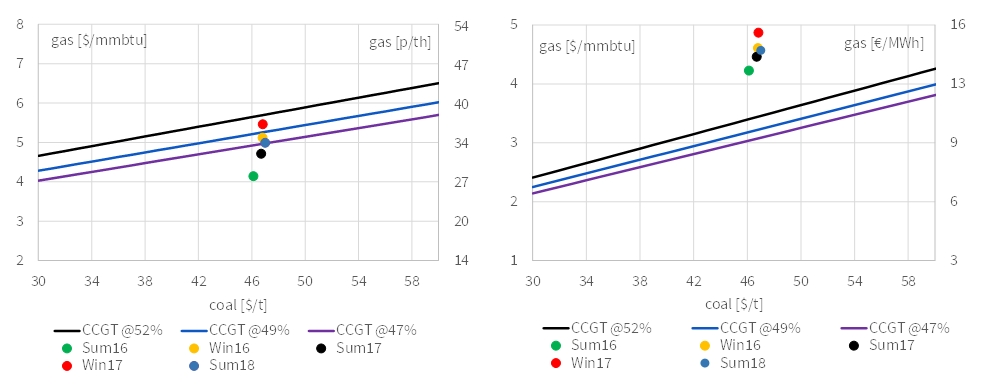
Chart 1 shows a current overview of the gas vs coal switching boundaries in the UK and Netherlands power markets.
These charts show whether current forward market prices favour gas or coal burn. The coloured dots represent different combinations of gas and coal prices for seasonal forward contracts over the next two years. The diagonal lines show the baseload switching boundaries for CCGT plants of different efficiencies (a 52% new plant through to a 47% 1990s plant). In simple terms, if the dots sit below the diagonal switching lines then market prices favour gas burn. If the dots sit above the switching boundaries they favour coal burn.
The UK and Netherlands both have significant volumes of gas and coal capacity installed. But the role and responsiveness of gas plant is very different across the two markets:
In the UK: Gas fired plants dominate the setting of marginal wholesale power prices. CCGTs also benefit from the UK carbon price floor which disadvantages coal plants. This means there is already significant switching taking place at current gas price levels, with newer CCGT running baseload and older CCGT running mid-merit, displacing the majority of coal plant capacity from the merit order.
In the Netherlands: Gas fired plants dominate the capacity mix like in the UK. But a significant portion of this gas capacity is must run CHP plant which is not responsive to market prices. In contrast to the UK, power prices are predominantly set by cheaper coal fired capacity in neighbouring Germany. This means that gas vs coal switching plays a limited role at current market prices (with the dots sitting 2-3 €/MWh above the switching boundary in the NL chart).
Key switching markets in Europe
The next step is to translate these drivers into a practical ranking of switching potential across European power markets. This is where the problem can be narrowed down to several key markets. More than 70% of European switching potential is focused on these top 5 markets:
- UK
- Italy
- Spain
- Germany
- Netherlands
If you also include the next 5 most important markets (Turkey, France, Belgium, Austria, Portugal), it accounts for approximately 90% of European switching potential. Turkey comes in a close 6th after the Netherlands, with higher installed capacity but some constraints around switching responsiveness.
In Chart 2 we show a representation of switching potential by market that combines some of the drivers listed above. The chart shows installed capacities of gas and coal plant on the vertical and horizontal axes respectively. The size of the bubbles for each market represents the historical range of gas burn in the market over the first five years of this decade (2010-14). This captures the transition from coal vs gas competitiveness being relatively balanced (2010-11) to strongly coal favouring (2013-14).
The advantage of this historical measure is that it is a transparent empirical benchmark. The disadvantage is that it is backward looking. While gas vs coal switching is the main driver of gas burn changes, there are some other factors in play (such as renewable erosion of gas plant load factors). As a result this measure provides an upper bound for switching potential.
When we come back in our second article next week we use an alternative forward looking approach to quantify gas switching volume potential. We use our pan-European power model to analyse gas switching volumes given different combinations of gas and power prices.
This approach illustrates the drivers set out this article, but provides a more detailed view of how switching is likely to impact gas and power markets over the next 3 years. Historical switching may be starting to reverse. But the market dynamics in the second half of this decade are going to be very different to the first.
Article written by David Stokes & Olly Spinks