The first half of this decade saw an LNG investment boom. High gas prices and optimistic Asian demand projections supported a flood of Financial Investment Decisions (FIDs) in new LNG liquefaction capacity. These investment decisions are the source of the current oversupply and depressed gas prices, conditions that are set to dominate the second half of the decade.
However since 2015, investment in new supply has almost dried up as global gas prices have crashed & converged. The impact of this investment drought is being concealed by a deepening supply glut. Long delivery lead times on projects already signed off mean there is more than 150 bcma of capacity still under construction to be commissioned by 2020. But a lack of investment beyond the current pipeline of new supply is creating the conditions for a price recovery early next decade.
While investment in new supply has ground to a halt, important structural drivers continue to support global demand growth. European import dependency is increasing as domestic gas production declines. Asian demand growth, while slower than the optimistic estimates of earlier this decade, is still a force to be reckoned with. And there are tailwinds for global gas demand from a growing focus on decarbonisation and reduction in coal burn.
The global gas market may still be descending into the tunnel of oversupply. But we suspect that this tunnel is shorter than many people think. And with long delivery lead times in the gas investment cycle, light may already be visible on the other side.
3 phases of global market rebalancing
In today’s article we set out our view of the path to global gas market price recovery. We break this recovery out into three phases:
- LNG glut: clearing the current global glut associated with committed new liquefaction capacity
- Russian pricing power: absorbing approximately 100 bcma of ‘shut in’ Russian production capacity
- New supply: A global requirement for incremental new production capacity
Last week’s article focused on a deeper dive analysis of Phase 1 and the mechanisms that can clear the current LNG glut. Today we use the same scenario framework but adjust our perspective to focus out over a longer time horizon into next decade.
Chart 1 shows the global market volume balance diagram from last week, overlaid on a schematic illustration of price dynamics for each of the three phases.
Chart 1: Schematic illustration of 3 phases of price recovery
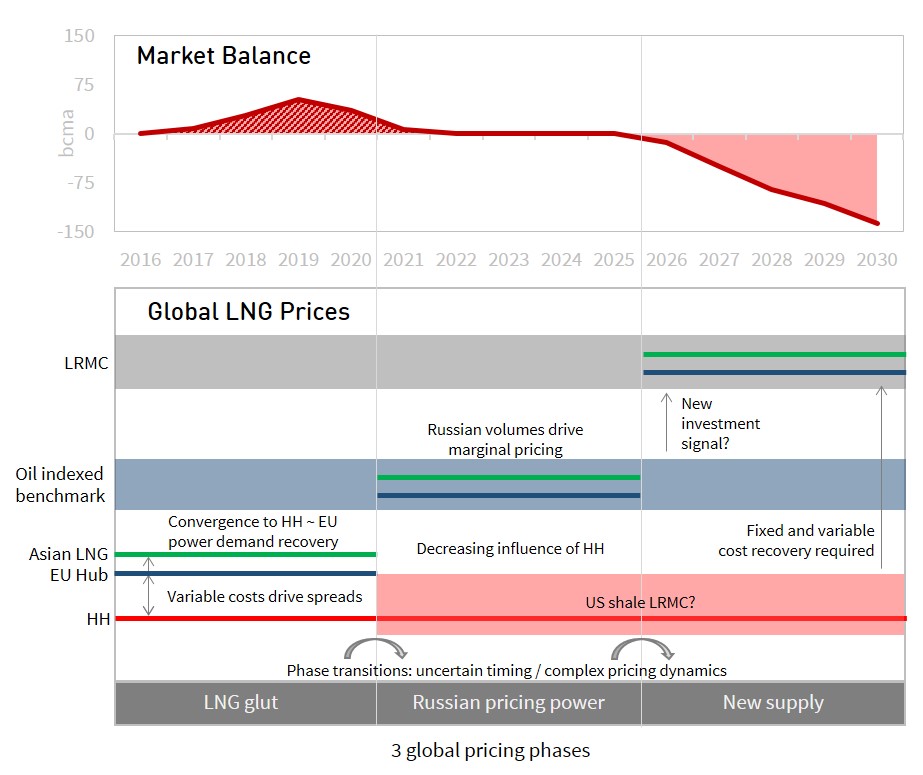
Source: Timera Energy
Phase 1: LNG glut
Phase 1 represents the world we are already in. Downward price pressure from a global surplus of LNG is forcing the convergence of Asian and European prices towards US Henry Hub support. Regional price spreads are increasingly converging to levels driven by the variable cost differentials of moving gas between regions. Phase 1 conditions are summarised in Table 1.
Table 1: Summary of Phase 1 - LNG glut
We set out last week the 4 key market clearing mechanisms likely to provide the incremental volume response to clear the LNG glut (European switching, Asian demand response, US & Australian LNG shut ins). If you believe Russia will materially change its strategy in response to lower prices then consider this is a 5th mechanism. The influence of these clearing mechanisms erodes the influence of long term oil-indexed gas contracts and shifts the focus towards Atlantic basin hub prices (e.g. NBP/TTF and Henry Hub).
The increasing importance of hub price signals and a rapid rise in flexible US export volumes, is set to support an increase in global gas market liquidity. Oversupply itself is a great catalyst for the development of market liquidity, given the requirement to clear surplus gas volumes via spot markets (e.g. as seen in Europe in 2008-10). These conditions set the stage for a declining influence of long term oil-indexed contracts and a rising importance of short to medium term hub linked deals.
Oversupply and maturing gas market liquidity also support the potential for a structural divergence of oil and gas prices. If the oil market stabilises and recovers before the gas glut is absorbed, then gas oversupply is likely to dampen the influence of oil-indexed contract prices in driving a parallel gas price recovery.
Phase 2: Russian pricing power
Phase 2 commences once the LNG glut has been absorbed and the world needs incremental supply. In our view that does not mean a sudden return to Long Run Marginal Cost (LRMC) driven market price signals, as many analysts assume. The reason for this is an existing surplus of Russian gas, over and above current contracted volumes. Phase 2 conditions are summarised in Table 2.
Table 2: Summary of Phase 2 – Russian pricing power
The key dynamic of the 100+ bcma of ‘shut in’ Russian gas is that it can be flowed into Europe based on Short Run Marginal Cost (SRMC) price signals. This shut in gas is located in West Siberian gas fields developed by Gazprom in anticipation of higher European demand growth. Loss of Russian market share from Gazprom to other Russian ‘independents’ has also contributed to the volume of shut in gas.
Prior to the building of a possible future Altai pipeline, this shut in gas is entirely in Europe-facing Russian fields. But it can also indirectly satisfy Asian demand growth by allowing flexible LNG flows (e.g. US exports) to be diverted to Asia, while Europe ‘backfills’ these with incremental Russian gas.
Gazprom has historically chosen not to flow this gas at price levels below existing long term oil-indexed contract prices. To do so would act as a catalyst for hub versus contract price divergence and development of hub liquidity, both of which Gazprom considers to be against its strategic interests.
This surplus of ‘shut in’ gas puts Russia in a very strong pricing position once the current LNG glut is absorbed. As long as Russia sells this gas at a sufficient discount to new LRMC, it can block new supply (e.g. in the form of new ‘second wave’ US export projects).
It is unlikely that Gazprom will significantly undercut its existing oil-indexed contract prices. This points towards a resurgence in the influence of oil-indexed pricing on hub prices (as has been experienced across much of the last 20 years).
It also sets up the conditions where European gas prices can diverge from Henry Hub. High volumes of flexible US export flows (80+ bcma capacity by 2020) are likely to ensure Asian and European prices remain structurally converged to variable transport cost differentials. But a tightening global market may result in greater short term inter-regional price volatility.
Phase 2 represents a key step on the path from SRMC to LRMC driven market price signals. While Russia is in a position to delay new LRMC driven supply, this is only a temporary situation. 100 bcma of Russian gas is likely to satisfy only 3 to 4 years of incremental supply requirements, less if you assume more robust global demand growth. Beyond that, the LRMC of new supply is set to reassert its influence on gas pricing.
Phase 3: New supply
Phase 3 is about the transition to investment in new LNG production capacity. This may seem a long way off (mid 2020’s in our illustrative scenario). But project delivery lead times are typically around 5 years. That means producers needing to convince themselves of a price recovery to cover LRMC, 5 years in advance of new supply coming online. The dynamics of Phase 3 are summarised in Table 3.
Table 3: Summary of Phase 3 – New LNG supply
The sources of new supply are not yet clear. But there appears to be a cluster of potential options in a 9-11 $/mmbtu LRMC range. These include ‘second wave’ US export projects, new Russian supply & Non-US LNG projects (e.g. East Africa & Canada). Wherever new gas comes from it will require a price signal from Europe and/or Asia.
As for Phase 2, market tightening is unlikely to result in structural Asian vs European price divergence (e.g. as seen post-Fukushima). By the end of this decade there will be large volumes of flexible supply that can arbitrage any structural price differences, including US export volumes and other LNG supply contracts with diversion flexibility.
Asian and European prices may diverge from Henry Hub in order to provide a market signal for new supply. But the extent of any structural diversion should be limited by the costs (fixed & variable) of developing new US export capacity.
The conditions for short term regional price volatility in a tightening market remain. There are structural lead times, often 2 to 3 weeks, for the LNG supply chain to respond to shorter term price regional price divergences. This volatility will be an important price signal for LNG portfolio supply flexibility.
What does the path to price recovery look like?
Breaking gas market rebalancing into phases of recovery helps focus in on the transition between the different drivers of global gas prices. The dominant driver of marginal pricing across the different phases is as follows:
- Phase 1: Atlantic Basin hub prices (Henry Hub, NBP/TTF)
- Phase 2: Russian pricing power and the revival of oil-indexation
- Phase 3: LRMC based competition to provide new supply
In Chart 2 we show how the three phases come together, in an illustrative scenario of the evolution of global gas prices to 2030. It is not a price forecast. The intention of this scenario is to present a reasonable view of the relationship between LNG market balance and regional price evolution through the three phases. To the extent your views differ on key assumptions such as demand growth, market balance and Henry Hub price evolution, the scenario can provide a useful point of contrast.
Chart 2: scenario projection of global price recovery (2016-30)
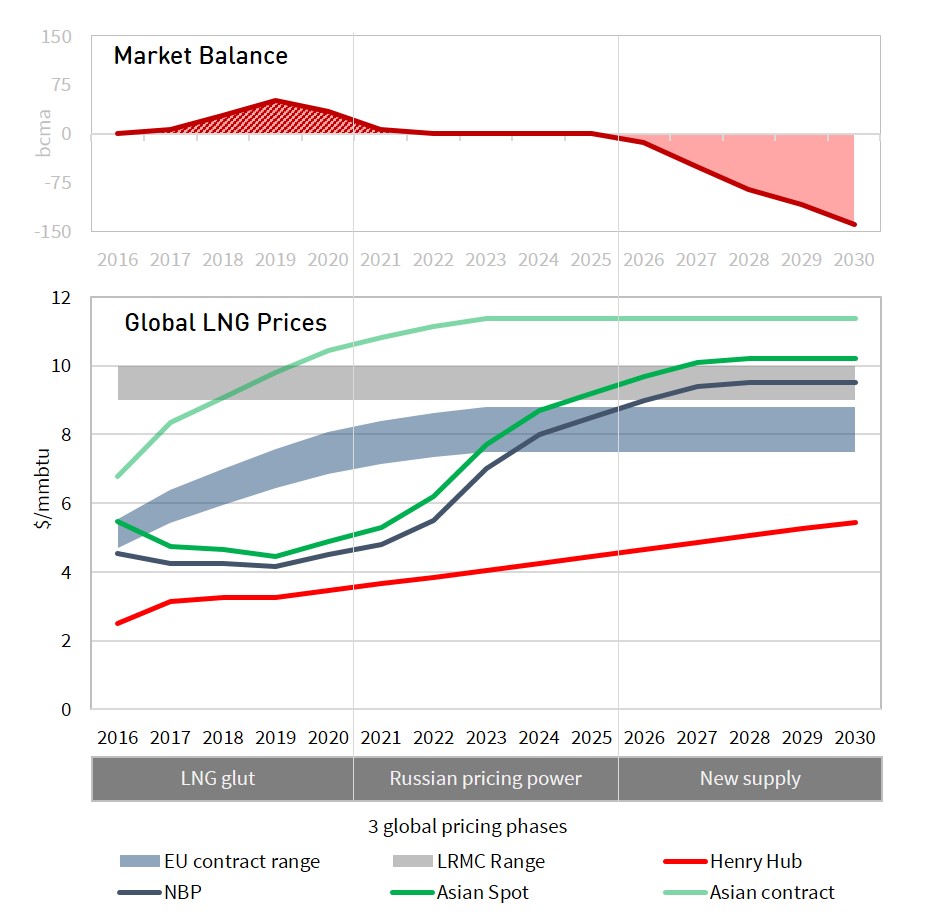
Source: Timera Energy
The scenario shows the convergence of regional prices until 2020, with Henry Hub providing key global price support in an oversupplied global market. Asian and European prices then undergo a significant recovery in the early 2020s as the LNG glut is absorbed. This is driven by the ability of Russia to exert its pricing power to lift prices back towards LRMC. This is likely to coincide with a revival of the influence of oil-indexed contracts on European hub prices.
New supply is required from the mid 2020’s. In practice this means upstream investors needing to convince themselves of a price signal to cover LRMC costs of new production, 4 to 5 years in advance. This LRMC price signal may start to emerge via long term contract prices underpinning investment in new supply, in advance of spot prices returning to LRMC levels. Or it may be that producers have to bear significant price risk in anticipation of market recovery.
Long investment lead times can actually result in the boom to bust cycle of this decade working in reverse. Price recovery may seem a distant prospect from the depths of the supply glut in 2018-19. But if new supply is not FID’d shortly after, the global market may once again be very tight by the mid-2020s. These boom/bust dynamics are an inherent characteristic of long upstream delivery lead times.
The timing of phase transition is a key source of uncertainty. Our scenario in Chart 2 is based on reasonably conservative demand growth assumptions. If global demand recovers more quickly, then the phasing logic is accelerated. Similarly, if demand growth is weak and/or investment in new supply comes too early, then there may be a slower progression through the phases.
But there are some important pricing dynamics that are likely to emerge regardless of phase timing:
- Europe will play a pivotal role in clearing the global gas market, given its liquid hubs, alternative supply sources, power sector switching potential and supply contract flexibility.
- European and Asian prices are likely to remain structurally converged, given a rapid growth in volumes of flexible LNG supply (driven particularly by US export growth).
- Short term inter-regional price volatility will not disappear, given there are structural lead times for the LNG supply chain to respond to market price signals.
- Gas market maturity will erode the dominance of long term contracts, with a shift in focus to managing exposures over shorter time horizons against liquid hub price signals.
- Intermarket linkages are becoming increasingly important, with growing connectivity between gas vs coal prices and US vs Europe vs Asia gas prices (and these are likely to grow in importance relative to the traditional gas vs oil price relationship).
The current gas glut is acting as a catalyst to support the evolution of these dynamics. Rebalancing, price recovery and the requirement for new upstream investment may be closer than you think. And the path to recovery is likely to drive a transformational evolution of the global gas market from the interlinked regional markets we know this decade.
Article written by David Stokes, Olly Spinks and Howard Rogers
| Client briefing pack
Timera Energy has published a client briefing pack ‘Global Gas Market – the path to market recovery‘. This includes an overview of current global pricing dynamics, how the LNG glut will be absorbed and the market evolution into next decade. You can download the briefing pack by clicking on the title link above or going to Our Publications. |