The post-Fukushima Asian LNG price premium saw European LNG imports fall by more than 50% across the 2011 to 14 period. In 2011, the year of the Fukushima disaster, Europe imported 91 bcm of LNG. By 2014 European LNG imports had fallen to 42 bcm, representing a 49 bcm reduction from three years earlier.
Over the same 2011-14 period European gas demand fell 65 bcma. This was predominantly driven by falling power sector demand as CCGTs were displaced by cheaper coal and renewable generators in power market merit orders. Asia’s ability to absorb high volumes of diverted European LNG across this period helped dampen the impact of falling demand.
But stepping forward to 2016, the Asian LNG spot price premium over Europe has all but gone. Asian spot prices have now essentially converged with European hub prices around 4 $/mmbtu. And LNG flows into Europe are increasing again despite an already oversupplied market.
European LNG import evolution
The 2011 Fukushima disaster marked the end of the last period of global oversupply, caused by the parallel effects of the financial crisis and 2008-10 ramp up in liquefaction capacity. Japanese LNG demand jumped (~30 bcma) as nuclear plants closed. At the same time, robust demand growth from developing importers and feed gas constraints for a number of exporters helped tighten LNG market conditions.
Fukushima also marked an inflection point for European LNG imports, as a tightening global market caused a rapid rise in Asian spot LNG prices. The Asian price premium that opened up over European hub prices across 2011-14 had two important effects:
- It created a strong incentive for European gas portfolios to flow flexible LNG cargoes to Asia, or to reload cargoes for re-export if contractual conditions precluded diversion
- It also created an incentive for European buyers to negotiate greater diversion flexibility into LNG contracts (both existing and new)
The combined impact of these effects was to divert almost 50 bcma of LNG from Europe to Asia across the 2011-14 period. Chart 1 shows the structural decline in LNG imports across this period.
Chart 1: Monthly profile of LNG imports
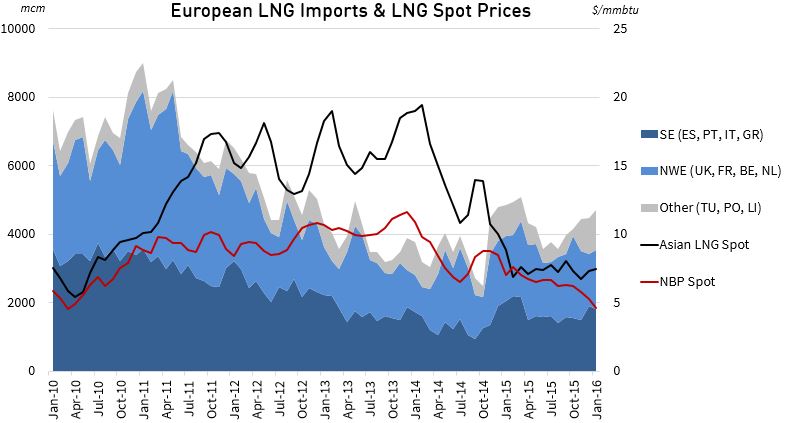
Source: IEA data (LNG flows), Reuters (Asian spot) & ICE (NBP spot)
2014 marked a major turning point in the global LNG market. The year began with spot prices above 20 $/mmbtu as Asian buyers chased cargoes. But by the end of 2014, Asian prices had crashed to half this level.
October 2014 marked the low point for European LNG imports this decade. However the signs of a turning point for imports were already emerging across the summer of 2014. In order to better illustrate this we have broken European imports down into 3 categories in Chart 1:
- Southern Europe: A grouping of regas terminals in less liquid gas markets dominated by Spain.
- North West Europe: Terminals connected to Europe’s liquid NBP and TTF hubs.
- Other: Terminals on the fringe of the European market which are less responsive to market price signals (Turkey, Poland, Lithuania)
The chart shows a clear recovery in LNG import volumes into NW Europe across the summer of 2014. This coincided with the re-convergence of Asian and European spot prices and a ramp up in surplus cargo volumes sold into Europe’s liquid hubs. Rising LNG imports was one of the factors behind a sharp decline in NBP/TTF hub prices across Summer 2014.
The trend of higher LNG imports into NW Europe has continued through 2015-16 as the global market has tipped into a state of oversupply. At the same time Southern European import volumes have stabilised as the incentive to divert cargoes to Asia has disappeared. The evolution of import volumes over the next three years of rapid supply growth will be a very important driver of European hub price dynamics.
Europe’s evolving role as a gas sink
As 2016 progresses, Europe is set to take on an increasingly important role as the LNG market of last resort. The liquid NW European hubs at NBP and TTF will set the price benchmark for surplus cargoes as LNG export volumes ramp up from new Australian and US liquefaction terminals.
In distance terms it may appear cheaper to flow much of this surplus gas into Mediterranean terminals. But there are two important factors that are likely to keep the focus on NW Europe:
- Regas terminal access costs in Southern Europe (particularly Italy) are high relative to NW Europe
- Access to liquid forward curves at NBP and TTF provide an ability to hedge the sale of cargoes ahead of delivery
This is good news for regas terminal operators (and terminal value) in NW Europe after what has been a tough period of lower than expected volumes versus those projections used to underpin terminal investment cases.
As imports into NW Europe increase the power sector will again come back into focus. Demand response from gas to coal switching in European power markets is set to play an important role in balancing the European market as hub prices fall. We return next week with a supply and demand balance view of the European gas market to illustrate this and other forces driving price evolution as 2016 progresses.
Article by David Stokes & Olly Spinks