Supply contract pricing terms are a key driver of marginal gas pricing dynamics in spot and forward markets. Contract prices can vary widely and terms are typically highly confidential. However similar structures tend to be used to price gas in different regions. For example Russian gas into Germany is predominantly indexed to gas oil and fuel oil on a six to nine month time lag.
The similarity in contract structures mean that proxy curves can be used to project the evolution of contract prices, as we set out in a recent article. Using proxy curves to gain an insight into the evolution of contract prices has important commercial applications. For example:
- Market analysis: Proxy prices for oil-indexed Russian supply contracts can be used to understand the influence of flexible Russian contract volumes as a key driver of European hub pricing dynamics
- Asset and contract valuation: Using proxy prices to understand the evolution of existing supply contract price levels is an important input when valuing new gas supply contracts
- Hedging: Proxy prices can be used to calculate the forward exposures of a portfolio supply contract to liquid traded products in order to support forward hedging decisions
The application of proxy curves however comes with a few health warnings.
Getting a handle on proxy risk
The use of proxy relationships in market analysis, asset valuation or hedging decisions can add additional risk that warrants explicit consideration. Proxy risk is where outturn prices differ from those implied by the proxy relationship leading to unexpected financial loss or gain.
There are two main causes of proxy risk:
- A poorly fitting proxy relationship between contract price and the underlying traded products to which it is indexed
- Implied exposures evolving or breaking down over time (e.g. from the increasing influence of gas hub pricing on European contract prices).
The first cause can be managed via a diligent proxy development process and common sense in proxy application (i.e. don’t place too much weight on a poorly fitting proxy). The second is more subtle and requires regular reassessment of the proxy curves to test integrity and suitability.
Case study: Proxy risk and the Average German Import Price
Arguably the most important use of proxy analysis in the European gas market relates to the opaque pricing of pipeline import contracts. It is common to use a proxy curve to forecast the value of the Average German Import Price (AGIP) published by the German ministry.
AGIP is an ex-post assessment of prices of gas imported into Germany. The vast majority of imported gas is under long term pipeline contracts indexed to gas oil and fuel oil (primarily Russian but also from the Netherlands and Norway). As such AGIP proxies will show strong relationships to averaged and lagged gas oil and fuel oil prices. However the basket of imported gas changes over time causing changes in the best fit proxy.
As an illustration, we have fitted a gas oil and fuel oil proxy for each of the last 5 years (i.e. each year, 12 months are added to the data used to calibrate the proxy to assess how it evolves). For simplicity we have used (9, 1, 1) – 9 month average, 1 month lag, fixed for 1 month – averaging logic for gas oil and a (3, 1, 1) for fuel oil and held this constant over all years for ease of comparison. In practice a better fit could be found using more complex averaging rules. The “best-fit” may also vary from year to year. The table below summarises the constants, coefficients and R2 for each year.
Table 1: AGIP proxy parameters
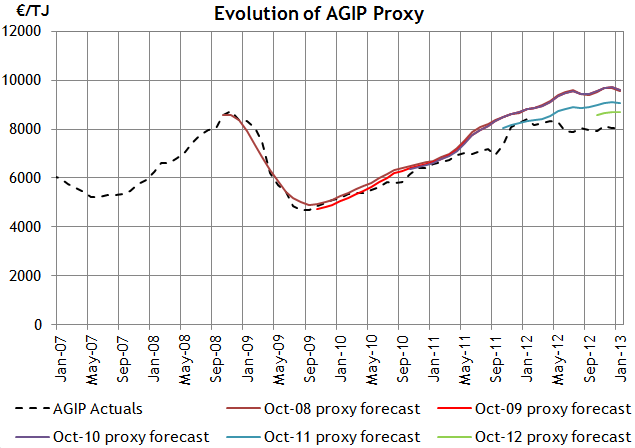
The chart below shows the prices as predicted by each of the proxy curves against the outturn AGIP prices.
Both the table and chart illustrate proxy risk in relation to AGIP prices. This can be seen in the chart where the 2008 and 2009 proxy curves provide a relatively good forecast of future prices, but the relationship starts to breakdown from the end of 2010 as actual prices disconnect from forecast prices. Relying on the 08-09 proxy relationship would have resulted in realised prices being structurally different from forecast, potentially distorting contract valuations and exposure measurement.
The breakdown in proxy relationship is also shown in the parameters of the proxy curves. The R2 (a measure of how well the proxy fits the historic data) begins to fall in later years. The coefficient for each subsequent regression also becomes less stable reflecting the changing influences of the price of German imports.
As an example of proxy risk impacting hedging decisions, AGIP was used as an indexation term in the Ruhrgas release auctions in the mid 2000. This meant that development of an AGIP proxy curve was important for informing pricing and hedging decisions (i.e. the slope coefficient can be used to imply the exposures to gas & fuel oil). If the AGIP proxy relationship had not been adjusted for changes in index or market conditions, proxy analysis would have likely resulted in unobserved residual oil and FX exposures. The gas oil coefficients implied for the proxies are relatively stable but the fuel oil less so (actually changing sign in the last year).
The breakdown and evolution of the AGIP proxy behaviour is consistent with the changing influences over the pricing of German imports. For example, growing levels of gas hub indexation and changes from reopener negotiations will both influence proxy price behaviour, requiring a re-adjustment of proxy fit. An initial starting point is to introduce gas hub prices into the proxy to improve the fit.
Proxy risks do not invalidate proxy analysis. Proxy curves are a useful tool in support of market analysis, asset valuation and hedging decisions. But it is important to define and understand the factors that may drive differences between outturn and projected prices. Most importantly an appreciation of proxy risks strengthens the commercial applications of proxy analysis.