There seems to be an increasingly polarised debate about the state of LNG market balance. This debate turns around use of the term ‘glut’.
In the red corner are the ‘supply glut’ crowd. Their view is that committed supply will outstrip demand for at least the next 5 years and that there is plenty of cheap gas beyond (e.g. from the US, Qatar & Russia) that should keep global gas prices subdued well into the 2020s.
In the blue corner are the ‘no glut’ crowd. Their view is that robust Asian demand growth will absorb new supply, with gas prices set to rise imminently, in response to a requirement for new liquefaction in the next 3 or 4 years.
With any observed decline in spot LNG prices, plenty of noise can be heard from the red corner about the building glut. On the other hand, any recovery in spot prices is a catalyst for the blue corner to embark on a bout of glut scepticism. It seems to us that there is a more constructive framework via which to track the evolution of the LNG supply & demand balance.
Regardless of market balance demand always equals supply. What is important about current LNG market dynamics is that two key price responsive mechanisms are facilitating market balancing:
- Asian demand response – lower LNG spot prices triggering a pick-up in demand
- European power sector switching – gas hub price signals inducing higher CCGT load factors
It is these mechanisms that are worth focusing on rather than glut semantics. In this context we set out two useful barometers for tracking LNG market balance.
Barometer 1: Asian vs European spot price spread
The first thing we watch for guidance on market tightness is the spread between Asian and European spot prices, illustrated in Chart 1. This spread is a price signal for flexible LNG cargo flow to Asia vs Europe.
Chart 1: Spread between TTF and Singapore spot LNG marker
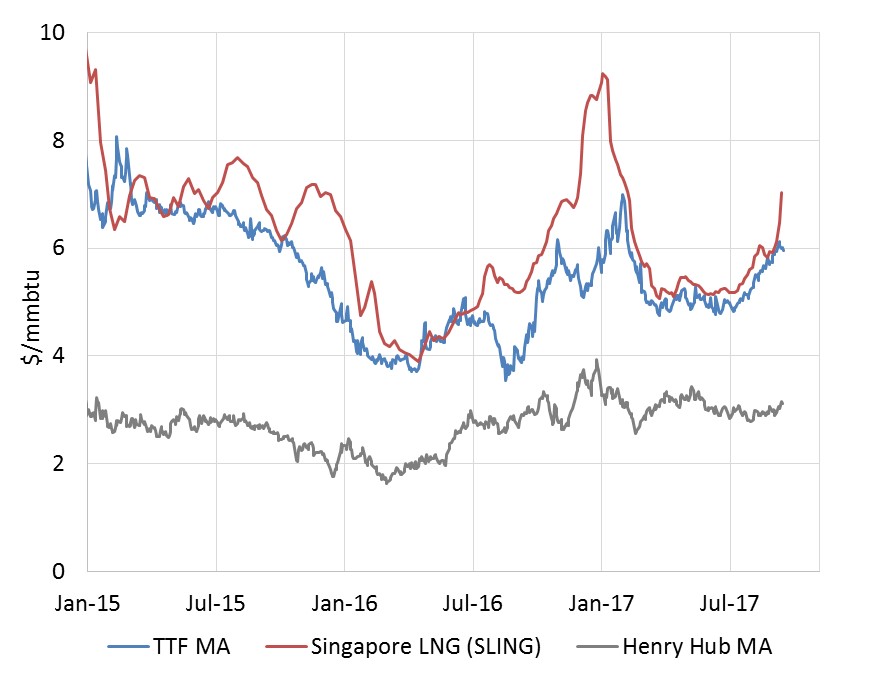
Source: Timera Energy (SGX for SLING data, ICE for TTF data)
This spread has been structurally converged since new supply started to outpace ‘business as usual’ demand growth back in summer 2014. Since this time European hubs have been driving global LNG spot pricing given the role of the European gas market as swing provider. The resulting Asian vs European spread convergence sits within a range of tolerance, typically capped around the 1.50 $/mmbtu transport differential required to pull significant volumes of additional LNG supply from Europe to Asia.
Structural convergence does not preclude periods of temporary price divergence and volatility. The best example of this was the supply outage and cold weather driven events of Dec 16 – Jan 17 we described previously. This month Asian spot prices have again perked up, helped by pre-winter buying and hurricane damage at Sabine Pass, with the JKM spot marker now above 7.50 $/mmbtu in Nov/Dec.
The Asia vs European spot price spread is a better indicator of LNG market balance than absolute gas price levels. This is because absolute gas price levels are strongly influenced by other commodity prices such as coal and oil. For example a 20% rally in coal prices since June has been a key factor lifting the gas vs coal switching point in European power markets, in turn pulling up gas hub prices (as we set out in our Angle column last week).
Barometer 2: European LNG import volumes
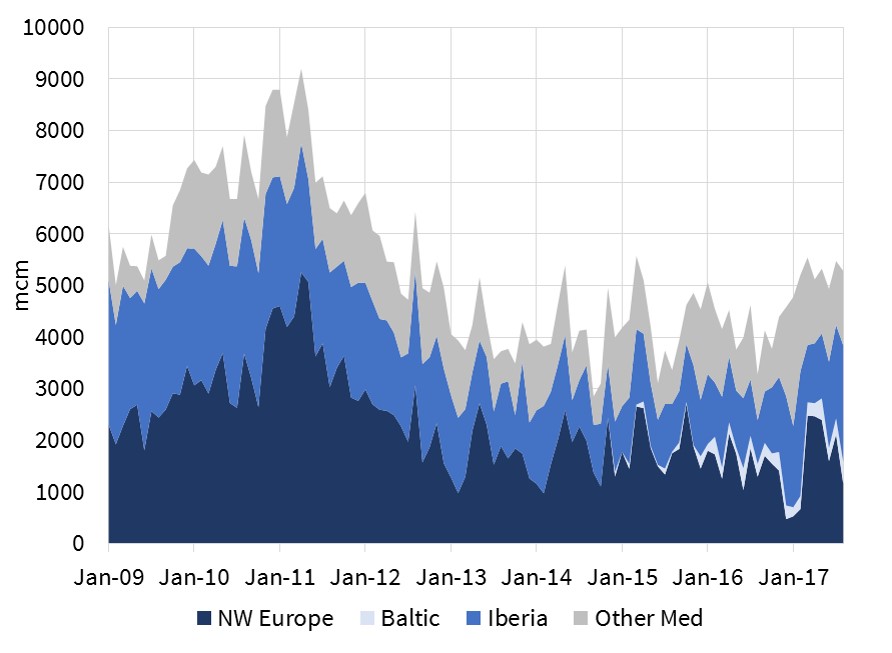
The second indicator we are watching closely is the volume of LNG imports into Europe as shown in Chart 2.
LNG cargoes that are surplus to Asian requirements typically flow to Europe. As a result, European import volumes are a useful indicator of how Asian demand growth is keeping pace with new supply.
European import volumes have been relatively strong over the last 12 months, particularly given robust Russian flows into Europe. Power sector switching has enabled the European market to absorb this supply, helped by higher coal prices.
But LNG import volumes are yet to define a convincing trend back up toward pre-Fukushima levels. Two factors have prevented a stronger growth in imports:
- Ramp up delays and outage issues with new production capacity (e.g. Gorgon, Sabine Pass)
- Robust Asian spot demand at lower prices, particularly from China this year
The LNG market has absorbed approximately 70 bcma (51 mtpa) of the current wave of new supply. What remains uncertain going forward is whether Asian demand response & delays of new supply will continue to enable Asia to absorb the remaining 130 bcma (96 mtpa) of liquefaction capacity coming to market over the next 3 years.
To the extent that this is not the case then watch for European LNG import levels to rise. If LNG flows to Europe do start to trend higher then the Asian vs European spot price spread will likely converge in a narrower range. At that point convergence of the trans-Atlantic spread between NBP/TTF and Henry Hub also comes into focus as an important third barometer.